Mapping nearly a century and a half of global marine fishing: 1869-2015
By Peter Aronson, SRC intern
Industrial fisheries are necessary for food security and public health worldwide. They are expected to become even more important as the human population grows and the climate changes. The global industrial fishing fleet has expanded to cover most of the world’s oceans, however there aren’t modern global overviews of the industrial fishing fleet. In this study, Watson and Tidd (2018) mapped global fishing patterns, demonstrating the value of mapping’s impact on fisheries management. Reliable data is available from as old as 1869 and has been compiled with recent data to better understand global fisheries patterns (Watson 2017).

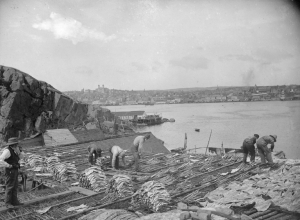
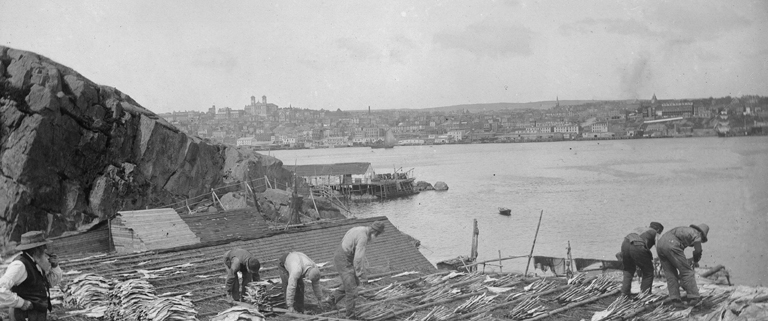
Figure 1: Fishermen drying codfish in Saint John’s, Newfoundland, Canada, circa 1900. Cod were once very abundant off Newfoundland, but the fishery collapsed due to overfishing and a moratorium was placed on cod in Newfoundland in 1992. Image source: McCord Museum, Wiki Commons.
Data was sourced from publicly available websites and used to compile a map of reported catches, which also contained estimates of illegal, unreported, and unregulated (IUU) fishing. Data from the United Nations Food and Agriculture Organization (UNFAO) was compiled from 1950-2015, and the most location-specific data was used. Data was adjusted to account for certain factors such as fishing gear, tuna fisheries, and satellite inaccuracies. Additionally, it was separated based on whether the fishery was industrial or non-industrial to determine each sector’s impact on fisheries and how to manage each on its own.
The only nations that reported their catch before 1900 were the United States, Canada, and Japan. More countries began reporting between 1900 and 1950, but fisheries weren’t as extensive because of a lack of technology for preserving fish once caught, causing fisheries to remain primarily coastal. Right before WWII, fleets expanded greatly. Reported catch declined again during the war, but after it rose right back to pre-war levels, and continued to increase greatly. By 2000, fisheries were very expansive, and the effectiveness of management and policies varied greatly. Despite more intense efforts, catch hasn’t increased in recent years. Mapping fishing efforts creates data which can track which countries are catching the most fish over time. Countries that have dominated fisheries at various times since 1869 include the United States, Canada, Japan, the United Kingdom, China, Peru, India, and the USSR. Fish caught prior to 1900 usually lived near the seafloor, but since target species have spread to fish living in the water column. Now, many types of species such as shrimp, squid, and tuna living in many ocean habitats are targeted. Although extrapolation of fishing gear to reported catch prior to 1950 wasn’t feasible, some technologies that had major impacts on industrial fishing had already arisen, such as steam engines, diesel propulsion, and freezers. Overall since 1950, practices involving seining have decreased and bottom and midwater trawling have increased.

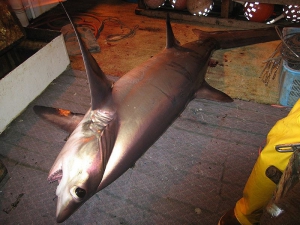
Figure 2: Many sharks are caught accidentally in fisheries when they aren’t targeted by fishermen. In this image, a bigeye thresher shark (Alopius superciliosus) was caught as bycatch. Bigeye thresher sharks are listed as vulnerable by the International Union for Conservation of Nature (IUCN).
Today, the fishing industry has become so advanced that it can capture fish almost anywhere on earth. Mapping is important because fish are a finite resource if used unsustainably, and fisheries could collapse. Fish not only feed, but nourish billions of people around the world, providing important nutrients that many people, especially in impoverished regions, can’t obtain elsewhere. Mapping allows for an accurate, easily communicable overview of the most heavily fished regions of the ocean, and where management is most needed. In the future, mapping fisheries may be even more important. Climate change threatens to change the distribution and productivity of stocks worldwide. As technologies improve, mapping will become more accurate. Fisheries have changed greatly since the 1860’s. Viewing patterns in fisheries since then can help inform and make better decisions about maintaining marine resources into the future.
Works Cited
Watson, R. A. 2017. A global database of marine commercial, small-scale, illegal and unreported fisheries catch 1950-2014. Scientific data 4: Article number 170039.
Watson, R. A., and Tidd, A. 2018. Mapping nearly a century and a half of global marine fishing: 1869-2015. Marine policy 93: 171-177.


