Rearranging the tree of life: a closer look at Ctenophores

By Shannon Moorhead, RJD Intern

At first glance, members of the animal phylum Ctenophora don’t look like much.  Commonly known as the comb jellies, ctenophores vaguely resemble true jellies of the phylum Cnidaria: marine organisms with translucent, gelatinous bodies that spend the majority of their time suspended in the water column.  Like cnidarians, comb jellies utilize tentacles with specialized cells to capture prey, usually zooplankton and animal larvae.  However, instead of nematocysts, stinging cells typical of jellyfish and anemones, to subdue prey, ctenophores have developed colloblasts, cells found in no other metazoan, animal, group (Ryan et al. 2013).  These colloblasts produce a glue-like substance; the animal extends its tentacles, colloblasts adhere to plankton passing by, and then the tentacles are retracted and food particles are moved to the mouth (Moroz et al. 2014).  Ctenophores also have a relatively uncommon form of locomotion for metazoans of their size.  Comb jellies propel themselves by beating hair-like cilia, arranged into eight tracts called comb rows, in unison.  The comb rows run the length of the animal, from the aboral to oral surface (side of organism without and with mouth, respectively) and their beating is controlled by the aboral organ, a primitive brain consisting of sensory apparatuses for gravity, balance, and light (Moroz 2015).  This is one major component of a fairly complex nervous system that also includes two nerve nets, nerves for controlling the tentacles, and basic mechano- and chemoreceptors, sensory cells that take in physical and chemical information, respectively, from the surrounding environment (Moroz 2015).  With such complicated methods of hunting and locomotion, it is no surprise that ctenophores need an extensive nervous system to effectively coordinate various parts of the body.

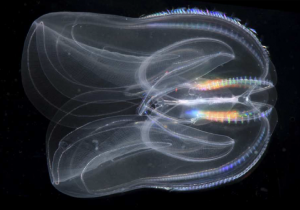
An adult Mnemiopsis leidyi, a representative member of the ctenophore phylum (Ryan et al. 2013)

An adult Mnemiopsis leidyi, a representative member of the ctenophore phylum (Ryan et al. 2013)

The fragile nature of ctenophores makes them hard to work with and, coupled with their lack of fossil record and available genomic data, they have been difficult to place on the phylogenetic tree of life.  Trees based on a variety of aspects, from morphological characteristics to ribosomal RNA analysis have placed ctenophores in a plethora of groups.  However, recent genomic analysis, coupled with analysis of the nervous system, supports a new location of ctenophores on the tree of life: as the sister group to all other Metazoan.  This would imply that comb jellies were the first group of animals to branch off on its own, and may mean that they are the closest living possible representation of the ancestral metazoan all animal life evolved from.

Previously proposed phylogenetic groupings of major metazoan lineages. Ct, Ctenophora; Po, Porifera; Tr, Placozoa; Cn, Cnidaria; Bi, Bilateria (Ryan et al. 2013)

Previously proposed phylogenetic groupings of major metazoan lineages. Ct, Ctenophora; Po, Porifera; Tr, Placozoa; Cn, Cnidaria; Bi, Bilateria (Ryan et al. 2013)

When thoroughly examined, stark differences between the genome, nervous system, and development of ctenophores and other metazoan groups (particularly those with nervous systems, bilateria and Cnidaria) can be found.  In their 2013 study, Ryan et al. sequenced the genome of the ctenophore Mnemiopsis leidyi, and determined that gene content data substantially supported the position of Ctenophora as a sister group to other animals.  Genomic analysis of the ctenophore Pleurobrachia bachei by Moroz et al. in 2014 had similar findings.  Notably, several genes known to contribute to development and patterning, the processes by which undifferentiated cells become specific structures during the growth of an organism from zygote to larva to adult, in other metazoans are completely absent.  For example, HOX genes, which are essential for controlling the body plan of bilaterians during development, are missing from ctenophores (Moroz 2015).  Not surprisingly, Moroz et al. 2014 found that Pleurobrachia express a multitude of genes not present in other metazoans early on in their development, suggesting ctenophores may have evolved an entirely unique set of development and patterning genes.

Comb jellies also have a variety of unique innovations, as well as the absence of usually essential metazoan genes, that indicate the independent evolution of their nervous system.  Moroz 2015 found the neurons of ctenophores had a non-polarized morphology: any part of the neuron can form a synapse onto another cell, far different from the typical bilaterian neuron with its signal-receiving dendrites and signal-sending axon.  Neuronal cell structures also form a “presynaptic triad”, a way of organizing the area of the neuron that sends transmits the signal to another cell that is unique to ctenophores (Moroz 2015).  Microscopy reveals a row of diverse, similarly-sized vesicles containing neurotransmitters just under the cell membrane, nearest to the synapse.  Behind the row of vesicles is a layer of smooth endoplasmic reticulum, followed by one or several large mitochondria.
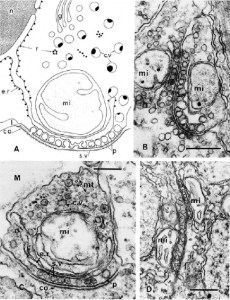
(A) drawing of an asymmetrical synapse with presynaptic triad. (B) Two-way synapse, with opposing presynaptic triads. (C) Asymmetrical synapse. (D) Soma-soma reciprocal synapse. c.v, cytoplasmic vesicles; e.r., endoplasmic reticulum; g, Golgi complex; M, mesoglea; mi, mitochondrion; mt, microtubules; r, ribosomes; s.v., synaptic vesicle (Moroz 2015).

(A) drawing of an asymmetrical synapse with presynaptic triad. (B) Two-way synapse, with opposing presynaptic triads. (C) Asymmetrical synapse. (D) Soma-soma reciprocal synapse. c.v, cytoplasmic vesicles; e.r., endoplasmic reticulum; g, Golgi complex; M, mesoglea; mi, mitochondrion; mt, microtubules; r, ribosomes; s.v., synaptic vesicle (Moroz 2015).

Observations of ctenophores via microscope also show they have a high diversity of synapses compared to other metazoa, though the most prevalent is the asymmetrical synapse.  The asymmetrical synapse is polarized, like in bilaterians, with one cell sending and one receiving a signal; the abundance of this type of synapse indicates that comb jellies primarily use unidirectional chemical transmitters to send a message from a neuron to another neuron, or another kind of cell (Moroz 2015).  Ctenophores also utilize soma-soma reciprocal synapses, where cells synapse onto each other at staggered locations, and two-way synapses, which are not found in vertebrates.  These two-way synapses involve the presynaptic triads of two neurons facing each other, meaning that signals are being transmitted in both directions across the synapse (Moroz 2015).  In addition to chemical synapses, ctenophores have gap junctions, electrical synapses formed by a protein connecting the cytoplasms of adjacent cells.  Moroz 2015 found that Pleurobrachia make twelve different gap junction proteins, though not connexin, the one most commonly used in chordates.  These gap junctions are most common in the aboral organ, tentacles, and combs, where the quick signal transmission allows for better coordination of movements.

Evidence suggests ctenophores have adapted their own set of neurotransmitters as well.  Moroz et al. 2014 was unable to detect common metazoan neurotransmitters such as acetylcholine, dopamine, serotonin, noradrenaline, adrenaline, and nitric oxide in Pleurobrachia.  They also found no genes encoding enzymes to make, as well as no genes encoding receptors for, these transmitters.  In the study, Moroz et al. determined that L-glutamate, an amino acid, is the most likely candidate for a ctenophore neurotransmitter.  This is supported by the ability of L-glutamate to cause muscle contractions along with the unprecedented variety of ionotropic glutamate receptors (iGluRs) in comb jellies.  During ctenophore development, iGluRs become present around the same time as neurons, indicating the two are associated and further supporting the candidacy of L-glutamate as a neurotransmitter (Moroz et al. 2014).
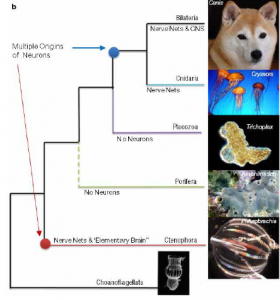
Phylogenetic tree based on recent studies, indicates the evolution of neurons at two separate points (Moroz et al. 2014)

Phylogenetic tree based on recent studies, indicates the evolution of neurons at two separate points (Moroz et al. 2014)

When examined closely, the glaring differences between the genes, development, and nervous system of ctenophores and other metazoans have significant implications for the understanding of animal evolution.  Ctenophores, and not sponges (Porifera) as previously thought, as the earliest diverging metazoan lineage would suggest that the nervous system evolved twice in metazoan groups, once in ctenophores and again in cnidarians and bilaterians.  The members of Porifera lack a true nervous system and most likely never had one; once an animal lineage has developed a nervous system it is far too valuable to lose.  This suggests that the common metazoan ancestor sponges, and also ctenophores, evolved from had not yet developed a nervous system.  If this was the case, then ctenophores and cnidarians/bilaterians had to develop nervous systems completely separately, hence the unique features of the ctenophore nervous system.  Convergent evolution of this complex a structure is unprecedented in the animal kingdom and this, along with other data gathered from ctenophores, could incite a complete reworking of the theories of animal evolution.

References

Moroz, L. (2015). Convergent evolution of neural systems in ctenophores. Journal of Experimental Biology, 218, 598-611.

Moroz, L. et al. (2014). The ctenophore genome and the evolutionary origins of neural systems. Nature, 000, 1-6.

Ryan, J. et al. (2013). The Genome of the Ctenophore Mnemiopsis leidyi and Its Implications for Cell Type Evolution. Science, 342, 1242592-1242592.

 

Fishery Collapses Explained by Overfishing, Life-History Traits, and Climate Variability

By Christopher Brown, RJD Intern

Species around the world have experienced significant declines below fixed thresholds that indicate the risk of extinction. Evidence has suggested that the risk of extinction runs high in terrestrial species that maintain large body sizes, feed high in the food chain, and demonstrate slow population growth rates. However, within marine ecosystems, species that exhibit fast population growth rates have been found to be just as likely to face the risk of extinction as species with slower population growth rates. Population growth rates can be understood as one of several factors that determine the risk of extinction. Additional factors that may influence the risk of extinction include climate variability and harvest dynamics. Overfishing, especially in waters unregulated by governing bodies, may play a strong role in population collapse. Recent studies have suggested that fast growing marine species subject to climate variability are more sensitive to overfishing than slow growing marine species.

Screen Shot 2015-10-25 at 9.44.33 PM

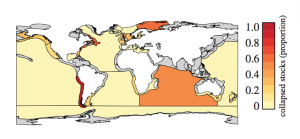
Figure 1: Proportion of fish stocks that have ever collapsed (Gray regions represent large marine ecosystems without fish stock status information) (Pinksy and Byler, 2015).

Screen Shot 2015-10-25 at 9.44.56 PM

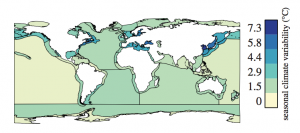
Figure 2: Seasonal climatic variability of large marine ecosystems (Pinksy and Byler, 2015).

Pinsky and Byler used boosted regression trees to analyze the effects harvesting, species traits, and climate variability had on one hundred and fifty-four fish populations located around the world. In regards to fish and fisheries data, population collapses were analyzed using the RAM Legacy Stock Assessment Database version 1.0. This large database withholds a time-series of both population biomass and fishing pressure dating from 1950 to 2008. A fish stock was defined as collapsed if the minimum annual biomass dropped below 20% of the biomass necessary to support a maximum sustainable yield (Pinsky and Byler, 2015). The climate variability of seventy large marine ecosystems (LME) was calculated using sea surface temperatures (SST) from an 1870-2014 HadISST dataset. The SSTs were averaged monthly within each LME and the time-series were de-trended by subtracting a linear regression from each set of values. Short-term climate variability was measured to analyze the seasonal cycles, in addition to long-term climate variability. The four main questions that were addressed included (Pinsky and Byler, 2015):

  • Do the interactions of fishing with rapid growth rates contribute to population collapses?
  • Are fishery collapses more likely in regions with more variable climates?
  • Do the interactions of climate and fishing contribute to collapses?
  • What are the relative influences of fishing, life history and climate on population collapses?

Pinsky and Byler found that LMEs that had the greatest seasonal climatic variability were either enclosed, coastal areas, or located at intermediate latitudes. The most depleted fish populations in these LMEs had the greatest overfishing durations, maintained faster growth rates, and experienced a significant amount of seasonal climatic variability. Fish populations that were subject to overfishing in LMEs with great climatic variability were determined to be about twice as likely to collapse than fish populations overfished in LMEs with less climatic variability. Even though overfishing was a dominant factor in the models used to analyze fish population collapse, it was determined that life-history characteristics and climate variability predispose fish populations to collapse and depletion (Pinsky and Byler, 2015). Fast growing species have short generation times, and slow growing species have longer generation times. Fish species with short life histories are more prone to collapse, especially if there is a long delay in reducing harvest rates after population growth declines. Fish species with long life histories are able to tolerate longer delays. Because fish species with short life histories are more difficult to incorporate into sustainable fishing practices, dynamic management is needed to rapidly reduce harvest rates when it appears that a fast-growing species is approaching a collapse. Population biomasses and fishing pressures must be monitored closely enough to detect the possibility of the collapse and depletion of global fish populations in order to keep fast growing species above the fixed thresholds that indicate the risk of extinction.

References:

Pinsky, Malin L., and David Byler. “Fishing, fast growth and climate variability increase the risk of collapse.” Proc. R. Soc. B. Vol. 282. No. 1813. The Royal Society, 2015.

Living on the Edge: Settlement Patterns by the Symbiotic Barnacle Xenobalanus globicipitis on Small Cetaceans


By Rachel Skubel, RJD Intern

If you were a barnacle, how would you choose your home? For X. globicipitis barnacles residing on striped dolphins, this question was ‘put under the microscope’ by Juan Carillo and colleagues at the University of Southern Mississippi and Cavanilles Institute of Biodiversity and Evolutionary Biology (Valencia, Spain).

Of all obligate barnacles studied, X. globicipitis has been found on animals that experience the most intense currents (Bearzi and Patonai, 2010). These organisms will settle on dolphins to optimize for (a) availability of passing current, to provide food, and (b) low drag from said current, to reduce physical degradation of the animal. Here, the investigators asked the following questions:

  1. Where do these barnacles choose to settle?
  2. How does this choice affect the barnacles’ recruitment (define), survival, and growth?

The researchers examined stranded striped dolphins (Stenella coerleoalba) along 556 km of the spanish mediterranean coastline (map), from 1979 to 2009. In 1990 and 2007, many of the dolphins examined had been killed by the morbillivirus (link to http://www.nmfs.noaa.gov/pr/health/mmume/midatlantic2013/morbillivirus_factsheet2013.pdf) – infected animals would have swam slower and had weaker immune systems than otherwise, making them more likely to be colonized by the barnacles. For each animal, the researchers looked at the abundance (i.e. amount), location, and size of the barnacles. Then, they used a model to investigate why barnacles were colonizing certain locations of the dolphins.

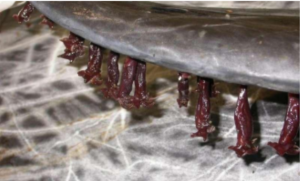
Figure 1: Barnacles were mainly found on the trailing edges of dorsal fins, flippers, and flukes, over an area ~2cm wide (Dr. Mariano Domingo, Autonomous University of Barcelona, Spain)

Figure 1: Barnacles were mainly found on the trailing edges of dorsal fins, flippers, and flukes, over an area ~2cm wide (Dr. Mariano Domingo, Autonomous University of Barcelona, Spain)

Results

Out of 242 dolphins examined, 104 had the X. globicipitis barnacles – on either their dorsal fins, flippers, and tail flukes. Of these locations, the tail flukes were by far the most common. Even if the dolphins had barnacles in multiple locations, linear density (barnacles/cm) was significantly higher on the tail. Also, the shell size of barnacles on the flukes was higher than on the flippers and dorsal fins. For these dolphins with barnacles on their tail flukes, it was more common to find them on the dorsal (top) than ventral (bottom) size of the tail.

Figure 2: When dolphins were found with X. globicipitis barnacles, they were most likely on the caudal fin.

Figure 2: When dolphins were found with X. globicipitis barnacles, they were most likely on the caudal fin.

Dolphins thought to have died from the morbillivirus did not have any significant differences in where the barnacles were located, or their size, compared to the unaffected animals.

Explaining the trends

When interpreting these results, it was important to consider that these were all pre-deceased study subjects, and the barnacles might have even settled on the carcasses. However, the finding of tail flukes being a popular settlement area for these barnacles matches with observations in the wild (see video below).

https://www.youtube.com/watch?v=8aJdW5IRZSs

 Beginning around 0:13, you can see barnacles are common on the tails of wild dolphins, supporting the findings of the present study by Carillo et al.

How do the barnacles choose where to dig in? The researchers propose that once they’ve used chemical cues to recognize the dolphins as proper hosts, a two-pronged mechanism follows.

  • First, attachment success: those that choose the tail to latch onto will be less likely to fall off in the process because there is some shelter from strong currents. And once one barnacle settles, it actually becomes easier for more to do the same because they will be ‘sheltered’ by this first individual.
  • Second, there is less early cyprid mortality, which means that once fully attached, it is easier to stay attached.

Lastly, the authors considered why there were more barnacles on the dorsal sides of the tails. This could be due to an asymmetrical swimming style by the dolphins, which means that their ‘downstroke’ is stronger than their ‘upstroke’, so there is less force on the settled barnacles if they settle on the top of the tail. However, whether the swimming style of these dolphins is symmetrical or assymetrical is not conclusively known.


References

Bearzi M, Patonai K (2010). Occurrence of the barnacle (Xenobalanus globicipitis) on coastal and offshore common bottlenose dolphins (Tursiops truncatus) in Santa Monica Bay and adjacent areas, California. Bull South Calif Acad Sci. 109: 37–44. DOI: 10.3160/0038-3872-109.2.37

Carrillo JM, Overstreet RM, Raga JA, Aznar FJ (2015) Living on the Edge: Settlement Patterns by the Symbiotic Barnacle Xenobalanus globicipitis on Small Cetaceans. PLoS ONE 10(6): e0127367. DOI: 10.1371/journal.pone.0127367


A changing climate impacts fish distributions

By Grace Roskar, RJD Intern

Long-Term Changes in the Distributions of Larval and Adult Fish in the Northeast U.S. Shelf Ecosystem

Fishing pressure and climate change have been linked to changes of the distribution of several fish species in past studies. These factors contributed to geographic shifts of fish populations to different areas and impacted the abundances of adult fish. In this study, researchers at NOAA studied initial stages of fish species’ life cycles to examine how these fish distributions have changed over time and space.

Many fish species switch habitats during different parts of their lives. Most fish species in the Northeast U.S. (NEUS) Shelf Ecosystem produce pelagic eggs. Pelagic eggs float among currents in the open ocean. The eggs hatch into larvae, grow into juveniles, and finally become adults. Since these different life stages often utilize different habitats, at the end of one stage, fish need to be ready to move to a new habitat for the next part of their lives. Past research has focused more on the adult stage than the larval stages. However, the early life stages of fish are critical because a species’ population abundance can be greatly affected by the survival rates of those earlier stages.

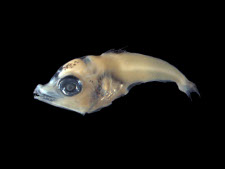
This photo shows a larva from the Scombridae family, which includes mackerels, tunas, and bonitos. The Scombridae family was one of fish families sampled by NOAA. Photo credit: NOAA http://www.sefsc.noaa.gov/species/fish/larval/photos_larva

This photo shows a larva from the Scombridae family, which includes mackerels, tunas, and bonitos. The Scombridae family was one of fish families sampled by NOAA. Photo credit: NOAA http://www.sefsc.noaa.gov/species/fish/larval/photos_larval.htm

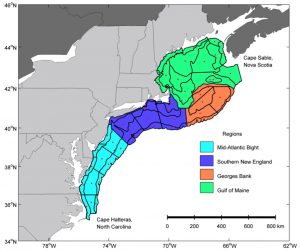
In this study, data from the NOAA Northeast Fisheries Science Center was used to analyze larval distributions in the NEUS Shelf. Past analyses showed that the adult fish distributions in this region have generally shifted towards the north or into deeper water. This study examined two time periods (1977-1987 and 1999-2008). The goals of Walsh et al. (2015) were to “1) examine changes in the spatial distributions of larval fish…2) examine changes in larval seasonal occurrence…3) compare changes in larval distributions to changes in adult distributions, and 4) evaluate changing distributions relative to regional occurrence, timing of larval occurrence, management status of adults, and habitat used by adults.” Larval fish samples were collected from the NEUS Shelf from North Carolina to Nova Scotia by two survey programs. Adult fish samples were collected using bottom trawl surveys over the same area and timeframe.

This figure shows the regions along the NEUS Shelf where sampling occurred. (Walsh et al. 2015)

This figure shows the regions along the NEUS Shelf where sampling occurred. (Walsh et al. 2015)

The results showed that 43% of larval species and 50% of adult species changed distribution. The changes in larval distribution indicate changes in “spawning, currents, survival, or some combination of the three,” (Walsh et al. 2015). This emphasizes the need for further examination into how each stage of the life cycle is connected in these regions. Around 50% of the total taxa exhibited a change in direction, either along the shelf, across the shelf, into deeper waters, such as the movement of Atlantic cod (Gadus morhua), or a combination of these. Most directional changes were towards the north, perhaps an effect of rising temperatures. For 60% of the taxa surveyed, “distribution changes differed between adult and larval stages,” indicating changes in the overall habitat range that species utilize throughout their lives (Walsh et al. 2015). This could be problematic for species if the distribution changes create longer migrations or longer distances between nursery and feeding grounds. These changes in distribution and life stages have significant ramifications for fisheries. When the distribution of a life stage is altered, the stock of the species changes, which can lead to different outcomes for the fishery each year.

Certain off-limits areas in the NEUS Shelf are meant to protect certain species by enforcing fishing regulations. However, when distributions change, the closings could be inadequate at protecting a species if the species simply is not there. Moreover, changes in larval fish distributions can have impacts on the whole ecosystem. For example, if populations are shifting northward, the larvae can be subject to new predators and interactions in the food web. This study showed distributional changes in both larval and adult fish taxa in the NEUS Shelf region. Of importance is that these are complex changes with many factors, such as timing and regional occurrences, which will affect the assessment and management of these resources.


References:

Walsh H.J., Richardson D.E., Marancik K.E., Hare, J.A. 2015. Long-Term Changes in the Distributions of Larval and Adult Fish in the Northeast U.S. Shelf Ecosystem. PLoS ONE 10(9): e0137382. doi:10.1371/journal.pone.0137382


The effect of environmental factors on fish movements

By William Evans, RJD Intern

Assessing environmental correlates of fish movements on a coral reef by Currey, et al. discusses the movement of fish dependent on environmental conditions. In this study, the researchers aimed to determine if environmental factors changed the location of Lethrinus miniatus, also known as the redspotted sunfish, on the reef to then make assumptions about the movement of that species as environmental factors change over time. There has been research done to show how fish react to changes in environmental stimuli but in relation to the environmental stimuli causing biological and behavioral alterations. In certain species, these alterations can be decreases in reproductive performance and slower growth rates.

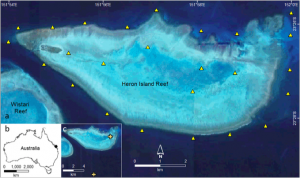
The researchers sampled at Heron Island Reef in the southern portion of the Great Barrier Reef. The fish were captured, using a rod and reel on the reef slope by using a bait of pilchard and squid as bait. They were captured using barbless 8/0 and quickly vented and anaesthetized with Aqui-S. Once captured, a V13P transmitter with pressure sensor capabilities was surgically implanted in the abdominal cavity of each fish between the pectoral and ventral fins on the left side. The fish were recovered in fresh sea water and then released at the same capture site. The capture, venting and tagging process occurred in 8 minutes or less.

IMG002

Each transmitter produced a different identification code of the same frequency to then relay data to the depth of that specific fish, with a maximum of 50 meters deep. To receive the data, 25 VR2 W acoustic receivers were deployed on the reef slope. Nineteen of the receivers were deployed on the reef slope and the other six were deployed in the lagoon. This arrangement of receivers was designed for a full year, of data collection and could detect acoustic transmitters within 270 m and 25 m deep. A total of sixty fish were tagged over three trips of twenty fish each: April 2011, February 2012, and September 2012.

The Facility for Automated Intelligent Monitoring of Marine Species sensor network and Great Barrier Reef Ocean Observing System mooring collected environmental data from April 2011 to September 2013 by on site monitoring. This environmental data included water temperature, atmospheric pressure, wind speed and direction, rainfall, and moon phase. The means of this data were averaged daily and weekly because of the vast amount of data collected over an extended period of time. These specific parameters were chosen because they were hypothesized to be the potential causes of reef movement among L. miniatus. Included in the biological parameters that were assessed, fork length (FL) was used to also determine if there was an effect based on fish size.Atmospheric pressure and wind direction data were not included in the final analysis because atmospheric pressure was correlated with water temperature and the data for wind was determined to be unbalanced because of the direction that the wind came.

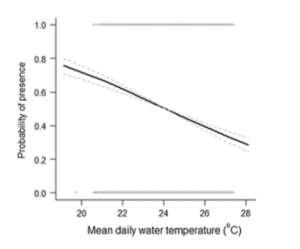
Fish were used in the final analysis when they were detected for more than 5 days and when a receiver recorded the same fish presence more than once in the same day. From the 60 L. miniatus originally tagged, only 26 were able to be used for the final data analysis. These fish ranged in fork length from 372 mm to 493 mm and we detected from 2 to 52 weeks throughout the study by the receivers. The data was processed using sixteen sub-models to analyze the environmental effects of reef presences of L. miniatus. One of the models predicted that there would be less than a 50% presence of them on the reef slope if the daily mean water temperature was greater than 24°C. All of the other parameters that were measured were not considered to be important for this specific study. From using this temperature data and tracking the fish for up to 12 months, the researchers could make some predictions about temperature change and the effect it could have on fish on the reef, specifically L. miniatus. The data displayed that as water temperature increased, the presence of L. miniatus on the reef decreased.

IMG001

Most of the studies concerning the effects of temperature on fish are about the biological changes in the fish such as changes in metabolism and sexual behaviors. This study can help predict the distribution of L. miniatus as temperatures increase or change their location in the water column in order to be at their preferred temperatures. Additionally, because increasing temperature was the main factor in determining the presence of L. miniatus on the reef, the researchers can infer that as temperature increases, the presence of the species will reduce on the reef slope. Although this study was only based around one species, this research can benefit managers in helping them understand how climate change will effect the movement of reef fishes and how the fishery will be impacted over time.


References:

Currey, Leanne M., Heupel, Michelle R., Simpfendorfer, Colin A., Williams, Ashley, J. (2015). Assessing environmental correlates of fish movement on a coral reef. Coral Reefs.

Donelson JM, Munday PL, McCormick MI, Pankhurst NW, Pankhurst PM. (2010). Effects of elevated water temperature and food availability on the reproductive performance of a coral reef fish. Mar Ecol Prog Ser 401:233–243.

Munday P, Kingsford M, O’Callaghan M, Donelson J. (2008a). Elevated temperature restricts growth potential of the coral reef fish Acanthochromis polyacanthus. Coral Reefs 27:927–931.


Baleen whales host a unique gut microbiome with similarities to both carnivores and herbivores

By Julia Whidden, RJD Graduate Student

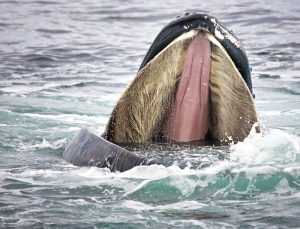
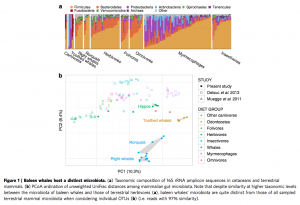
“Microbiome” is the term used to describe the communities of microorganisms that live inside a host, and includes microorganisms that are beneficial, detrimental, and neutral to host health. Some of these microorganisms are vital to digestion, but the diversity, composition, function, and source of an animal’s microbiome is still largely understood. For example, the microbiome of the herbivorous panda bear was expected to host communities similar to other herbivores with the same diet, while in actuality its communities were discovered to be more similar to other closely related yet omnivorous pandas. Cetaceans, or dolphins and whales, evolved from artiodactyls, which were terrestrial animals that fed on plants. Other modern-day animals evolved from artiodactyls include cows and hippopotamuses, or ruminants, and are similar to this ancestor in their herbivorous diet. The main polysaccharide, or large carbohydrate that herbivores acquire from their diet is cellulose. Whales, however, are carnivorous. Even baleen whales that are filter feeders consume small fish and crustaceans, digesting another large carbohydrate, chitin, from the ‘shells’ of their prey. Despite vastly different diets, ruminants and whales share a multichambered foregut, which is used in these animals to help digest the tough structure of the large polysaccharides they consume. This study investigated the microbiome of baleen whales to determine whether their community composition was more similar to their ancestor and distant relatives, the herbivores, or to their carnivorous diet.

Whale baleen

Fecal samples were collected from wild baleen whales in the Bay of Fundy, Canada, in August 2011, and were complemented by samples of captive cetaceans and wild terrestrial animals. The wild fecal samples were obtained by first locating and identifying the whales, and then samples were scooped from the water immediately following defecation. Captive cetacean and wild terrestrial animal samples included Pacific Humpback whales, Atlantic white-sided dolphins, bottlenose dolphins, Beluga whales, hippopotamus, and other unnamed wild terrestrial carnivores and herbivores. DNA extraction from the fecal samples isolated 16S ribosomal RNA (rRNA), which is involved in protein synthesis in ribosomes. An analysis of 16S community sequence was performed, which indicates the diversity in a microbiome by identifying the number of gene variants present, assuming each microorganism has a different variant of the gene. The microbiome diversity within each group of animals – including the baleen whales, toothed whales, terrestrial herbivores, and terrestrial carnivores to name a few – was then compared (see Figure 1 below).

Screen Shot 2015-10-17 at 10.26.23 PM

Results indicated that the microorganisms of the baleen whale’s microbiome involved in the digestion of polysaccharides were similar to those of terrestrial herbivores. This is intuitive, as the chitin that the baleen whales consume is similar in structure and function to the cellulose that herbivores consume. Further, the baleen whale microorganisms responsible for breaking down proteins and building amino acids – which make up proteins – were more similar to the microbiome of the terrestrial carnivores analyzed. This study concluded that microbiome composition is determined by a mix of the host’s past and present, incorporating microorganisms associated with their ancestor’s diet, as well as their modern diet.

What happens to the seahorses that you accidentally land in your trawl net?

By Stephen Cain, RJD Intern

For millennia our ancestors fished the world’s oceans. Today’s fishing fleets are the most effective in all of human history, extracting ever-larger quantities of wild fishes. Only recently have scientists shown that seas are vulnerable to overexploitation, which can put species at extinction risk. Meanwhile, human population growth places increased pressure on marine resources to feed billions, thus representing a significant share of global trade.

The Convention on International Trade in Endangered Species of Wild Fauna and Flora (CITES) is a multinational treaty with the mandate of monitoring and regulating species trade such that wild populations remain healthy. But do large, multi-national efforts such as CITES actually work? Writing in Aquatic Conservation: Marine and Freshwater Ecosystems, researchers Sarah Foster, Stefan Wiswedel and Amanada Vincent attempt to answer this question by analyzing CITES data and by using seahorses (Hippocampus) as a case study.

2002 was a noteworthy year for CITES. For the first time in nearly 25 years the international body added a marine fauna, seahorses, to its list of Appendix II species. According to the agreement, such species are of a conservation concern in the absence of regulation, and any of the 180 member nations trading in Appendix II species must demonstrate through monitoring that trade does not harm wild populations.  Previous biologic surveys of seahorses analyzed by Foster et al. showed that extensive trade existed. The genus’ life-history characteristics, such as small home ranges, low fecundity and density gave scientists cause for concern over the long-term sustainability of global populations.

SFoster_bycatch

Photo Credit: Sarah Foster

Foster and her team reviewed CITES monitoring reports for the first seven years of the Appendix II listing (2004-2011). They wanted to determine its successes and obstacles, as well as uncover key relationships between market demand, trade routes, and the sources of trade.

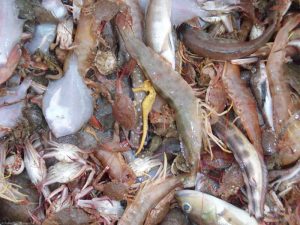
Surveys undertaken prior to the implementation of the CITES listing showed that millions of individuals were traded annually. Seahorses were exported primarily as dried specimens for traditional Chinese medicine (TCM), and to a lesser degree as live individuals for aquaria. Remarkably, commercial trawlers that obtained seahorses as by-catch or non-targeted species met the larger demand for TCM markets. When seahorses were specifically targeted as catch, they were taken alive and destined for the aquaria trade. The United States imported the largest number of live seahorses during the study period.

In all, Foster et al. identified 31 out of 47 species of the genus Hippocampus as important species to international trade, four of which dominated by volume (H. kelloggi, H. kuda, H. spinosissimus, and H. trimaculatus). The top four, the authors noted, are species listed as threatened by the IUCN.

While reporting gaps and inconsistencies made definitive findings challenging, Foster and her team suspect that it is unlikely that the demand for seahorses has diminished in the years following the CITES designation. Monitoring of trade emerged as one of the greatest challenges for the treaty. Some countries known to export quantities of seahorses did not report. Other countries failed to specify the unit volumes of exports, which made it difficult to form a clear picture of international trade. Taken together, however, Foster et al. interpreted the monitoring failures as an area of opportunity for CITES.

The challenge now is for international authorities to build member capacity in annual reporting. For this, the researchers suggested that automated record validation, a process aided by new technology, could add precision to the accounting of imports and exports. In addition, standardized educational materials for species identification could strengthen the accuracy of reporting, and trade surveys could give a fresh perspective on species abundance. The promptness of the reporting also needs improvement. In some instances a country’s current reporting period represented data collected two years prior.

The measures of success for a CITES listing really come from accurate longitudinal data. As long as countries around the globe participate in and strengthen monitoring practices, Foster and her team are confident it can be a useful tool in the conservation of species. But the team is cautious in the case of seahorses. CITES listings may have little bearing on species caught as by-catch. Commercial fishers who cash in on seahorses from by-catch are capitalizing on a market demand for a fishing pressure that they have already exerted, even if accidentally. The question of whether or not they can undo that pressure, either by altering gear types or by releasing non-targeted species, is a complicated one. In the end, the decision may not rest squarely on the shoulders of the international community, but on our species.


You can find this paper in Aquatic Conservation: Marine and Freshwater Ecosystems

Foster, S., Wiswedel, S., & Vincent, A. (2014). Opportunities and challenges for analysis of wildlife trade using CITES data – seahorses as a case study. Aquatic Conservation: Marine and Freshwater Ecosystems, http://doi.org/10.1002/aqc.2493

For the latest on seahorse research, conservation, and news, see Project Seahorse

http://seahorse.fisheries.ubc.ca/


Can Marine Protected Areas Help Conserve Intertidal Species?

By Hannah Calich, RJD Graduate Student

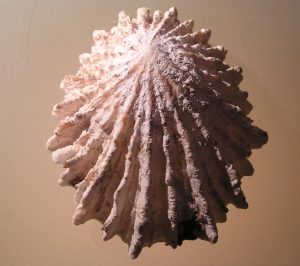
The giant limpet (Patella ferruginea; Figure 1) is one of the most endangered species in the Mediterranean Sea. As with many other marine species, their population decline has been attributed to overexploitation by humans. Giant limpets are most commonly harvested for food, fishing bait, or shell collection.

A giant limpet. Photo by: Jan Delsing / Wikipedia Commons

A giant limpet. Photo by: Jan Delsing / Wikipedia Commons

Much of the giant limpet’s remaining population is found within Sardinia’s marine protected areas (MPAs) and national parks. The population found within the Penisola del Sinis – Isola di Mal di Ventre MPA, is particularly important because despite being home to only a few hundred individuals this population has strong genetic differentiation, which is important for population recovery.

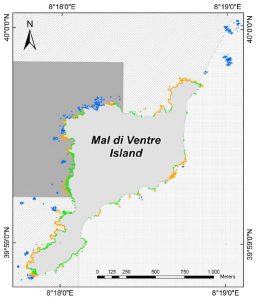
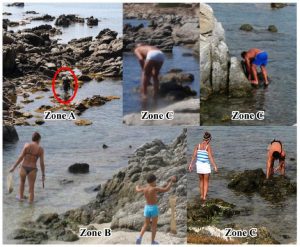
Unfortunately, giant limpets are being illegally harvested from within the Penisola del Sinis – Isola di Mal di Ventre MPA. In light of this finding, Coppa et al. (2015) set out to determine how much protection MPAs provide for intertidal species. Specifically, Coppa et al. (2015) investigated how site accessibility (semi-accessible vs. hardly accessible) and legal protection (high, medium, and limited protection) impact poaching levels and population size of the giant limpet within the Penisola del Sinis – Isola di Mal di Ventre MPA (Figure 2).

Map of Penisola del Sinis - Isola di Mal di Ventre MPA that highlights accessibility levels and protection zones. Zones A, B, and C have high, medium, and limited legal protection, respectively. Figure from Coppa et al. (2015)

Map of Penisola del Sinis – Isola di Mal di Ventre MPA that highlights accessibility levels and protection zones. Zones A, B, and C have high, medium, and limited legal protection, respectively. Figure from Coppa et al. (2015)

Figure 2b

The results of annual field surveys in 2011 and 2013 showed that the total population of giant limpets has declined 52% in two years as a result of illegal harvesting. However, this decline was not consistent throughout the MPA. There was a significantly higher density of giant limpets in hardly accessible sites compared to easily accessed sites. Additionally larger individuals, which are targeted by poachers, were predominantly found in sites with maximum legal protection that were hard to access. If the current levels of illegal harvesting continue the authors predict that the giant limpet may face local extinction within the next 10 years. These results suggest that this MPA is only protecting limpets in certain areas and unfortunately, this protection is insufficient.


Local people collecting intertidal invertebrates within Penisola del Sinis - Isola di Mal di Ventre MPA. Photo from Coppa et al. (2015)

Local people collecting intertidal invertebrates within Penisola del Sinis – Isola di Mal di Ventre MPA. Photo from Coppa et al. (2015)

The results of this study emphasize the fact that simply implementing an MPA is not necessarily sufficient to ensure species protection. This is particularly true for intertidal species that are easily accessed by illegal harvesters. Coppa et al. (2015) suggest that joint efforts between enforcement agencies, regulators, and researchers are a crucial component to ensure MPAs are able to meet their conservation objectives.


Reference:

Coppa, S., De Lucia, G. A., Massaro, G., Camedda, A., Marra, S., Magni, P., Perilli, A., Di Bitetto, M., Garcia-Gomez, J. C., Espinosa, F. (2015). Is the establishment of MPAs enough to preserve endangered intertidal species? The case of Patella ferruginea in Mal di Ventre Island (W Sardinia, Italy). Aquatic Conservation Marine and Freshwater Ecosystems. DOI: 10.1002/aqc.2579


Conservation of Amsterdam Albatrosses

By Samantha Owen, RJD Intern

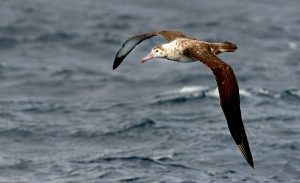
This paper outlines the current conservation efforts for the Critically Endangered Amsterdam albatross (Diomedea amsterdamensis) and the threat posed by industrial longline fisheries. In 2007 a population survey estimated that there were only 167 Amsterdam albatrosses in the world.  This is largely because they are only found in one place, Amsterdam Island, in the southern Indian Ocean.  Their population declined dramatically in the 1960s and 1970s due to the increase in industrial longline fishing targeting bluefin tuna.  While diving below the surface of the water when feeding, birds can be accidentally hooked or entangled in the longlines.

Like most albatrosses, this species is a biennial breeder, which means they only breed every other year. In between breeding years, they spend the entire break year roaming at sea.  A successfully mated pair will produce only one egg per breeding year.  This means that with such a small population, any mortality could have a huge impact on the viability of this species.  The established threshold to trigger a population decline is a loss of more than six individuals to bycatch per year. The potential number of individuals removed from the Amsterdam albatross population each year due to longline fishing is 2-16 depending on whether mitigation measures such as tori lines, plastic streamers trailing from the back of the boat used to scare birds away, were systematically employed.

amsterdam albatross

This paper quantifies the potential threat from industrial longline fishing fleets to the Amsterdam albatross based on time of year and life stages.  It shows that even though the Amsterdam albatross is potentially in contact with longline fisheries at every stage of its life, non-breeding individuals have a much higher susceptibility due to their significantly increased roaming area during their break year at sea. The time of year when Amsterdam albatrosses are at the highest risk for mortality as a result of bycatch in longlines is the austral winter (July, August, September) when fishing fleets are targeting albacore and other tunas.

The Taiwanese longline fishing fleet poses the greatest threat to Amsterdam albatrosses, followed closely by the Japanese fleet. One reason it is thought that the Taiwanese fleet has such a high impact on the Amsterdam albatross is because they deploy the most longlines in the waters immediately adjacent to the species’ home, Amsterdam Island.

In conclusion, this paper states three recommendations for further conservation efforts. First, increasing the coverage of fishing operations by dedicated observers in the distribution range of the Amsterdam albatross during the austral winter.  This would ensure the successful implementation of bycatch mitigation measures such as tori lines. The second recommendation is for Regional Fisheries Management Organizations (RFMOs) such as the Indian Ocean Tuna Commission (IOTC) to require all operating vessels to report ring recoveries.  All Amsterdam albatrosses have been fitted with leg bands (rings) identifying each individual. Although it would not directly prevent bycatch, reporting all recovered rings would allow scientists to more accurately define population-specific bycatch patterns in regional areas resulting in more targeted conservation efforts.  The third recommendation is to implement regulations on fishing efforts in the waters surrounding Amsterdam Island during the austral winter.  The combination of these three conservation efforts would allow the world’s only population of the Amsterdam albatross to grow and prevent any further decline that might very well result in the extinction of the species.


References:

Thiebot J.B., Delord K., Barbraud C.B., Marteau C., Wemerskirch H. 2015. 167 individuals versus millions of hooks: bycatch mitigation in longline fisheries underlies conservation of Amsterdam albatrosses. Aquatic Conservation: Marine and Freshwater Ecosystems. DOI: 10.1002/aqu.2578

Bioaccumulation of Toxins in Shellfish and the Consequences for Human Health

By James Keegan, RJD Intern

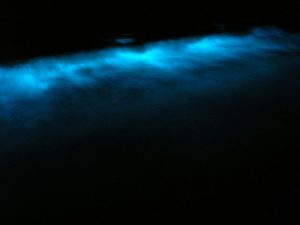
Toxic shellfish and toxic seafood in general are not modern phenomena. Human practices and records indicate that shellfish poisoning has been around for hundreds if not thousands of years. Many believe that diet restrictions dictated by the Bible demonstrate a wariness of shellfish poisoning. Moreover, Native Americans would keep watch for the flickering of ocean waves, an indication of dinoflagellate abundance, in order to know when to stop eating shellfish (Williams et al. 1999). Dinoflagellates are tiny marine organisms ultimately responsible for shellfish toxicity as well as the infamous red tides. More recently, the first published description in the Western World of a patient with symptoms of shellfish poisoning dates back to 1689 (Williams et al. 1999). A more famous example may be the poisoning of Captain Vancouver’s crew in British Columbia, Canada, in 1793 after they consumed toxic mussels (Landsberg 2002).

800px-Dinoflagellate_bioluminescence

Bioluminescent dinoflagellates lighting a breaking wave. Image source: Wikimedia Commons

Today, doctors recognize that the ingestion of shellfish can cause several types of neurologic diseases. These diseases include shellfish poisoning, diarrheal shellfish poisoning, and neurotoxic shellfish poisoning, but paralytic shellfish poisoning is one of the most common (Williams et al. 1999). Commonly implicated varieties of shellfish include mussels, clams, oysters, and scallops. Paralytic shellfish poisoning is caused by saxitoxin found in certain shellfish (Williams et al. 1999). Because saxitoxin is heat stable, steaming and cooking do not affect its potency, so both raw and cooked shellfish can cause paralysis. Moreover, commercial processing does not eliminate the toxin. The onset of symptoms of paralytic shellfish poisoning is rapid, occurring within 30-60 minutes of ingestion. Victims complain of a feeling of pins and needles, numbness, vertigo, and tingling of the face, tongue, and lips. There are no antidotes for saxitoxin or paralytic shellfish poisoning; however, even patients with severe symptoms do well if quickly supported by respiratory systems (Williams et al. 1999).

Although shellfish contain the toxins that cause these neurological diseases, they do not produce them. Instead, these toxins come from toxic microalgae like dinoflagellates. They serve as food for the shellfish, which filter and concentrate them in digestive glands (Williams et al. 1999). Because shellfish filter feed, they can take up toxic cells from these microalgae directly from the water column (Landsberg 2002). Shellfish then store and accumulate toxins as they feed on microalgae, and these accumulated toxins can become harmful to consumers once ingested. Shellfish naturally ingest a variety of dinoflagellate species, so their toxin profiles vary depending on the toxicity of the dinoflagellate to which each population is exposed. Many toxic microalgae have sedimentary or resting stages as part of their life cycle, and in some cases, these stages may be more toxic than the floating planktonic ones. These stages can be up to 1000 times more toxic, so shellfish filtering sediments can be exposed to much higher levels of toxins (Landsberg 2002). Moreover, the location and concentration of toxins in various tissues varies between species. For example, scallops do not accumulate toxins in their adductor muscles, the only part usually consumed, so they are normally safe for public consumption (Landsberg 2002).

800px-Shellfish

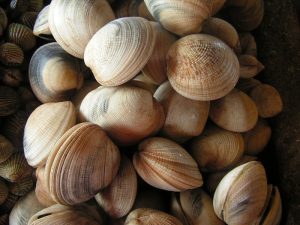
A pile of clams. Image source: Wikimedia Commons

Although toxins are widely distributed among shellfish, generally long-term toxin deposition had not seemed to cause them adverse health effects. However, in recent years, researchers have begun to focus on the effect toxins have on shellfish and found that they may indeed harm or even kill shellfish (Landsberg 2002). This assertion gains credibility as several studies have shown that shellfish behaviorally avoid the consumption of toxic dinoflagellates (Landsberg 2002). Examples of this would be closing shells, reducing pumping and filtration rates, increasing mucus production, modifying burrowing behavior, and changing cardiac activity or oxygen consumption (Landsberg 2002). Therefore, the accumulation of toxins in shellfish has health consequences for both the shellfish themselves and the animals higher up on the food chain.

The most effective way of managing shellfish poisoning is prevention. For centuries, humans have recognized that toxic seafood coincides with certain seasons of the year, water temperatures, weather conditions, seabird mortality, and the color of the waves (Williams et al. 1999). These methods are not exact, so monitoring programs use more modern techniques when determining potential shellfish toxicity. Programs have recently used mice to monitor toxin levels in shellfish by extracting their accumulated toxins and injecting them into the mice (Williams et al. 1999). Low concentrations may have little effect while high concentrations will kill the mice. Although effective, scientists would like to find a more rapid and direct method to monitor potential shellfish toxicity that does not require the use of mice. Scholin et al. 1999 developed a method to monitor microalgae, the ultimate source for shellfish toxicity, and their concnetrations. A floating robotic instrument will take in seawater and break apart any floating cells. It will then recognize certain microalgae by the presence of their DNA and relay this information to monitoring stations onshore. This system is still not completely ready, but it promises a much faster reaction time to fluctuating levels of microalgae.

esp-scott3

The MBARI-designed robotic instrument called the Environmental Sample Processor. Image source: NOAA.gov

Modern coastal monitoring agencies have decreased incidence of shellfish poisoning by restricting shellfish harvesting during high-risk periods, such as the period from late spring to early fall (Williams et al. 1999). Recent outbreaks of shellfish poisoning have occurred on isolated islands where public health monitoring is infrequent (Williams et al. 1999). Accumulated toxins cause illness in people, but only with elevated levels during certain periods of time. With vigilant surveillance, consumption of shellfish does not pose a significant health risk to humans.


References:

Clark, RF, SR Williams, SP Nordt, AS Manoguerra. (1999) A review of selected seafood poisonings. Undersea & hyperbaric medicine 26:3, 175–184.

Landsberg, Jan H. (2002) The Effects of Harmful Algal Blooms on Aquatic Organisms, Reviews in Fisheries Science 10:2, 113-390, doi: 10.1080/20026491051695

Scholin, C. A., R. Marin III, P. E. Miller, G. J. Doucette, C. L. Powell, P. Haydock, J. How- ard and J. Ray. (1999) DNA probes and a receptor binding assay for detection of Pseudo-nitzschia (Bacillariophyceae) species and domoic acid activity in cultured and natural samples. Journal of Phycology 35:1356–1367