Global Review of Social Indicators used in Protected Area Management Evaluation

By Josh Ratay, SRC Intern
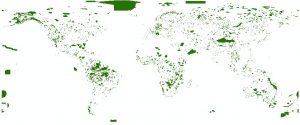
Figure 1

Global map of the world’s protected areas. These areas are numerous and often require a great deal of management assessment, in which social indicators play a large role. Image from University of Maryland, Baltimore County, using data from the United Nations Environment Programme.

Although conservation deals heavily with environmental data, social aspects of conservation initiatives are also extremely important. When human-related considerations are taken into account, certain trade-offs must often be made, but the end result is usually more effective at fulfilling the goals of the project, particularly at the local level. In a recent study, researchers examined the social aspects of protected areas around the world, relating social indicators and well-being dimensions. These went beyond simple measures of wealth and included education, healthcare, government, and social unity.

A pre-existing database, the Global Protected Area Management Effectiveness Database (GDPAME), which contains records of assessments made at different protected areas around the world. It contains information about both social and environmental factors and is used by policymakers as a source of information. For the study, social indicators were any factors that were placed in the context of local/indigenous affairs. Multiple existing frameworks were used to analyze indices of well-being. Indicators were examined in different scenarios, and classified as positive, negative or neutral. Differing methodologies for assessing protected areas very greatly in the number of indicators used, ranging from 13 to 429. The percentage of indicators relating to social issues also vary greatly, with a minimum of 7% and a maximum of 60%. Interestingly, the methodology which used 60% social indicators was exclusively for marine protected areas (“How is Your MPA Doing?”).

Figure 2

“How is Your MPA Doing?”, a manual released as a collaboration between NOAA, WWF, the IUCN and others, serves as a method for evaluating MPAs which focuses heavily on social indicators.

The study found that the most common dimension of well-being to be taken into account was living standards. Security and culture were also high-ranking. Overall, about one quarter of all indicators were social, showing that conservation management is increasingly taking social considerations into account. However, the study did recommend additional actions that should be taken to further increase coverage. Firstly, it proposed greater focus on community dynamics, as opposed to purely physical measurements such as resource availability. Additionally, many of the indicators focused heavily on the state of a conservation project after its implementation, and put less emphasis on local engagement during the early phases of an initiative. Changing this could better promote community participation by involving locals in the building of a policy, instead of only the continued management of existing policies. Additionally, the cultural values of a given area should be given increased consideration. The study also noted the bias toward describing environmental impacts of human initiatives as negative, and recommended that more specific language be used for future indicators. Overall, this review of social indicators and well-being dimensions showed the importance of integrating local communities in both the planning and assessment methods of protected areas to improve the effectiveness of conservation initiatives.

Work Cited
Corrigan, Colleen, et al. 2016. “Global Review of Social Indicators used in Protected Area Management Evaluation.” Conservation Letters.


Light Pollution Induces Increased Seabird Mortality

By Olivia Schuitema, SRC Intern

Light pollution has increased fiercely over the last century, resulting in mass fatality events in seabirds, one of the most endangered groups of birds (Rodríguez, 2017). This phenomenon, called “grounding,” happens when land-based artificial lights attract seabirds to the shore, causing them to crash into human-built structures such as buildings and fences (Rodríguez, 2017). Once on land, the disoriented birds (Troy, 2013) are vulnerable to predation, starvation, and vehicle collisions, leading to the mass-mortality events.

Figure 1

Composite image of continental U.S. at night, showing light pollution (NASA, 2016).

In reviewing current literature on the topic, data shows that twenty-four of the seabird species most likely to ground due to artificial lights are listed as “globally threatened” on the IUCN Red List (Rodríguez, 2017). A large number of the species affected are petrels and shearwaters (Figure 2). Juvenile individuals flying from the nest for the first time, or “fledglings,” make up 68%-99% of all grounding seabirds (Rodríguez, 2017). Seabird disorientation and the path where fledglings are drawn off course towards land are still uncertain (Troy, 2013), but scientists hypothesize the artificial lights drown out the natural light of the moon and stars.

Figure 2

Newell’s Shearwater, Puffinus newelli (Hawaii.gov).

Three strategies can be taken to prevent the loss of seabird life: avoidance, minimization, and rehabilitation (Rodríguez, 2017). Avoidance (avoiding practices that are known to cause fatalities) can be implemented in both new and current housing developments; new developments can refrain from installing light systems associated with groundings (Rodríguez, 2017), and current communities can remove or turn off lights that are not being used. Minimization reduces the duration and intensity of artificial light on seabird individuals (Rodríguez, 2017), and can be implemented in areas of overlap between humans and seabirds. Rehabilitation is also a method used to rescue grounded birds, where stranding teams and people of the public bring individuals to designated rescue stations. Here, the birds will undergo rehab until they are in “release condition.” However, not all birds survive grounding or rehabilitation efforts, but can be used as indicators of various marine environmental conditions (Rodríguez, 2017). Long-term scientific studies can also utilize seabird carcasses to address issues such as oil pollution (Stienen, 2017).

Figure 3

Seabird Rehabilitation Sanctuary in Ponce Inlet, Florida (Wikimedia Commons).

There is still little information known about seabird attraction to artificial lights. Scientists recommend researching the ecology and biology of vulnerable seabird populations and the effects of light intensity on grounded individuals (Rodríguez, 2017). New classes of lights that are useful for humans, but safe for seabirds can also be explored (Troy, 2013). Overall, seabirds are of great ecological importance and have ecotourism value that support many local economies. As light pollution increases, seabirds are continually at risk of grounding, leading to possible mass-mortality events.

Works Cited

Rodríguez, Airam, Holmes, Nick D., Ryan, Peter G., Wilson, Kerry‐Jayne, Faulquier, Lucie, Murillo, Yovana, . . . Corre, Matthieu Le. (2017). Seabird mortality induced by land‐based artificial lights. Conservation Biology, 31(5), 986-1001.

Stienen, Courtens, Van de Walle, Vanermen, & Verstraete. (2017). Long-term monitoring study of beached seabirds shows that chronic oil pollution in the southern North Sea has almost halted. Marine Pollution Bulletin, 115(1-2), 194-200.

Troy, J., Holmes, N., Veech, J., & Green, M. (2013). Using observed seabird fallout records to infer patterns of attraction to artificial light. Endangered Species Research, 22(3), 225-234.

A right whale pootree: classification trees of faecal hormones identify reproductive states in North Atlantic right whales (Eubalaena glacialis)

By Brenna Bales, SRC Intern

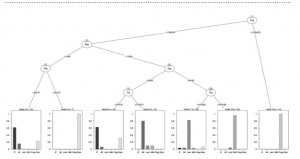
Faecal samples are a surprising wealth of information. One might think that the end product of digestion would not hold more information than simply what an animal has eaten, but in fact, animal excretions can give information about stress levels, sexual maturity, and physiological condition. In this analysis, 112 faecal samples of 81 individually identified North Atlantic right whales (NARW) (Eubalaena glacialis) were assayed for four hormone metabolites: cortisol (stress hormone), oestrogen (female sex hormone), testosterone (male sex hormone), and progesterone (female pregnancy hormone) (Corkeron et. al., 2017). The results were then used to classify each whale in a tree diagram, in one of the following categories: mature male (MM), immature male (IM), immature female (IF), pregnant female (Preg), lactating female (Lact), and resting female (mature, non-pregnant, non-lactating) (Rest) (Figure 1).

Figure 1

The constructed tree of known reproductive states of North Atlantic right whales (Eubalaena glacialis) (Corkeron et. al., 2017).

In order to confirm results, the hormonal identifications were compared with previously collected life-history data from the NARW Identification Database (Right Whale Consortium, 2012). The surveying efforts of these whales off the Eastern coast of North America extends back to 1986, with 80% of the population sighted each year (Hamilton et. al., 2007). This is key to confirming the results of a 13-year data set, and supplements the claims that NARWs are an ideal species for faecal analysis, due to the wealth of identification data. Furthermore, the consistent diet of the whales, minimal temperature variation in the study area, and the rapid collection of samples make this faecal hormone analysis possible.

Figure 2

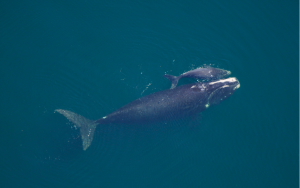
A North Atlantic right whale and calf swim side by side. (source: http://www.noaanews.noaa.gov/stories2009/ images/whale_andcalf.jpg).

Cortisol hormone concentrations can also be used to identify stress levels in NARWs from anthropogenic impacts, similar to what has been done in killer whale (Orcinus orca) populations, relating boat traffic to stress (Ayres et. al., 2012). As environmental stressors continue to mount, wild, free-ranging marine animal populations are at risk. The confirmation of anthropogenic impact is essential, so appropriate conservation actions can be taken. In conclusion, this classification of sexual maturity is useful in estimating the proportion of breeding individuals in the NARW population, and hopefully can be used in future studies to assess the health and reproductive abilities of the population.

References
Ayres KL, Booth RK, Hempelmann JA, Koski KL, Emmons CK, Baird RW, Balcomb-Bartok K, Hanson MB, Ford MJ, Wasser SK (2012) Distinguishing the impacts of inadequate prey and vessel traffic on an endangered killer whale (Orcinus orca) population. PLoS One 7: e36842.

Hamilton PK, Knowlton AR, Marx MK (2007) Right whales tell their own stories: the photo-identification catalog. In SD Kraus, RM Rolland, eds, The Urban Whale: North Atlantic Right Whales at the Crossroads. Harvard University Press, Cambridge, MA, pp 75-104.

Right Whale Consortium (2012). North Atlantic Right Whale Consortium Identification and Sightings Databases 31 December 2012 (New England Aquarium, Boston, MA, USA).

The Importance of Deep-Water Coral on the Antarctic Continental Shelf

By Sianna Raquel Vacca, SRC Intern

Throughout history, both natural and man-made causes have resulted in long-lasting effects on the oceans. While most organic processes yield gradual change, the impact of human activity alters nature by prompting and accelerating otherwise irregular events (e.g. rapid ocean acidification, warming, habitat destruction), diminishing the oceans’ supply of pristine areas and ecosystems. A “pristine ecosystem” is defined as an area that has been either minimally affected or entirely untouched by human activity/influence. The depletion of these pristine areas impedes upon the ability to observe marine environments in their natural, undisturbed states. However, not all pristine marine habitats have been affected just yet.

Figure 1

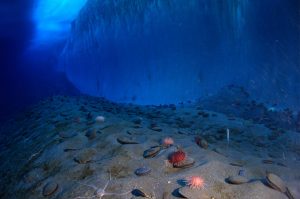
Antarctic seafloor depicting an array of marine organisms including Antarctic scallops and brittle stars. Pixabay.

A study conducted by a group of scientists based in Barcelona, Spain recently explored the pristine populations of deep-water corals on the Antarctic continental shelf. Thanks to geographical factors, the practically desolate waters of the Antarctic have provided protection to these gorgonian species from human influence and this study, as one of the first of its’ kind, has contributed to filling several gaps regarding the population characteristics of this species. While little was known about their distribution, abundance, and demographics, ROVs (remotely operated vehicles) have proven that gorgonians play an important role in the creating the geographical structure of many Antarctic continental shelfs by adding a three-dimensional aspect to their habitat. The purpose of this study was to learn about and understand the ecological role of these corals, which can be used in conservation efforts.

The results showed that coral populations in Antarctic benthic environments were not only booming, but that their distribution gradually differed between the Northern and Southern regions of the Weddell Sea. They thrive at depths of 250-350m and despite such extreme conditions, gorgonian density is similar to coral population values in temperate and tropical ocean floors. This discredits the widely accepted belief that species richness proportionately decreases with increasing latitude. Hydrodynamic conditions are also favorable for gorgonians at these depths by accumulating particle suspension in the near-bottom water layers. These strong currents are advantageous by providing a constant food supply and keeping reefs clear of sediment.

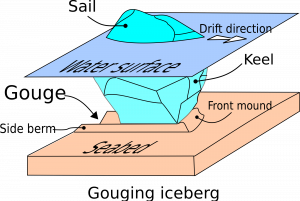
While gorgonian populations proved to be overwhelmingly healthy in the Antarctic, they are exposed to certain environmental threats that a tropical reef would never face. Due to their slow growth rate and reproduction type, gorgonians are especially vulnerable to iceberg scouring. Iceberg scouring events occur when icebergs drift into shallow areas and come into contact with/scrape the seafloor as it moves along. Additionally, anthropogenic activities such as bottom-trawling and by-catch fishing result in large habitat destruction for these species. The authors of this study hope to bring awareness to the abundance and health of gorgonians, which can at least begin to protect them from human-related threats.

Figure 2

A diagram portraying iceberg scouring, the process by which icebergs scrape the seafloor as it drifts through the ocean. Iceberg scouring events pose a threat to gorgonian species on the Antarctic continental shelf because of their slow growth rate, reproduction type, and inability to quickly recover. Flickr.

References

Ambroso, Stefano, et al. “Pristine Populations of Habitat-Forming Gorgonian Species on the Antarctic Continental Shelf.” Scientific Reports, vol. 7, no. 1, 25 Sept. 2017, doi:10.1038/s41598-017-12427-y.

The effects of elevated temperature and ocean acidification on the metabolic pathways of notothenioid fish

By Abby Tinari, SRC intern

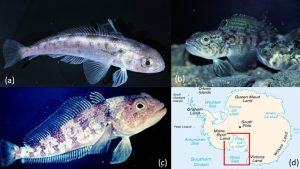
Notothenioid fish are typically found in the deep, cold waters of the Southern Ocean. Three species of fish native to the Ross Sea were studied to see how they may react to warmer and more acidic oceans.

Figure 1

(a) Pagothenia borchgrevunki (http://adam.antarcticanz.govt.nz), (b) Trematomus newnesi (http://adam.antarcticanz.govt.nz), (c) Trematomus bernacchii (Wikimedia Commons), (d) Ross Sea Location (Wikimedia Commons)

Methods

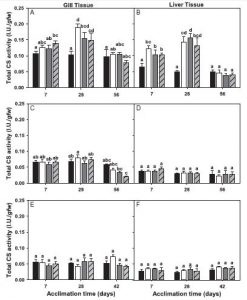
To measure the effects of temperature on the fish, individuals were randomly selected and placed in one of the four experimental treatment tanks. The experimental tanks consisted of a control treatment, a low temperature and high pCO2, high temperature and low pCO2, and high temperature and high pCO2 to test the individual and overall effects of temperature and pCO2 on the three-fish species. pCO2 is the partial pressure of carbon dioxide in the water. Each fish had an acclimation period that lasted anywhere from 7 to 56 days. Measurements of fish condition and growth were recorded over the course of the experiment. A few tests were performed to analyze enzymatic changes in the liver, white muscle tissue, and gills. One of the tests, the citrate synthase activity test measured how well the fish can release stored energy.

Results

T. bernacchii, the emerald codfish, was the only fish to display any significant impact from the treatments. The growth and condition declined significantly due to temperature but slowed as the acclimation period increased. The group of fish with the faster acclimation period had the largest decline of condition and growth, especially those that also had the multi-stress (high temperature and high <em>p</em>CO2) treatment. The temperature also influenced the Emerald Codfish’s oxygen consumption and metabolic rate. The high <em>p</em>CO2 tank had a small increase in metabolic rate. There were significant increases in citrate synthase activity, the first of which occurred after 7 days in the multi-stress treatment in the gills. By the 28-day acclimation, all treatments had significantly increased in both the liver and the gills.

The bald notothen, P. borchgrevinki, metabolic rates were significantly affected by temperature in the shorter acclimation periods. Interestingly, the oxygen consumption rates decreased in the high temperature treatments over time. Time and temperature were the main drivers in the citrate synthase activity increase in the gill tissues.

Metabolic rates in T. newnesi differed significantly between the acclimation groups with temperature as the main effect. No significant difference between pCO2 and temperature was present. There was however, an increased oxygen consumption rate after the 7 and 28-day acclimation period. The T. newnesi showed the least sensitivity to the treatments. The changes in Citrate synthase activity were not statistically significant.

Figure 2

Citrate synthase enzyme activity (±SE) of Trematomus bernacchii gill (A) and liver tissues (B), Pagothenia borchgrevinki gill (C) and liver tissues (D) and Trematomus newnesi gill (E) and liver tissues (F) acclimated at 7, 28 and 42 or 56 days to a control treatment (low temperature + low pCO2; black bars), low temperature + high pCO2 (white bars), high temperature + low pCO2 (dark gray bars) and high temperature + high pCO2 (light gray bars with cross hatches). Groups not connected by the same letter are significantly different from each other. (Enzor et al. 2017)

Discussion

This group of fish, the Notothenioid fish are critical to the Ross Sea food web. The three-species studied are consumed by seals, penguins, and other top predators. Studies like this one help to predict population responses for not only the Notothenioidei suborder but also other species which depend on these individuals for food.

Temperature had a greater adverse effect on the energy demands for two of the studied species. The fish may be able to acclimate to the higher temperatures, but only to an extent. Higher temperatures may mean a decreased ability to efficiently ingest food leading to decreased growth and other detrimental effects as seen in the Emerald codfish.

It should be noted that the long-term implications of the temperature and pCO2 on growth should be cautiously interpreted due to the small sample size and lack of growth even in the control samples.

References

Enzor LA, Hunter EM, Place SP (2017) The effects of elevated temperature and ocean acidification on the metabolic pathways of notothenioid fish. Conserv Physiol 5(1): cox019; oi:10.1093/conphys/cox019

Dispersants: A Modern Method For Cleaning Up Oil Spills: Advantages and Disadvantages

By Nicole Suren, SRC intern

In 2010, the Deepwater Horizon oil rig in the depths of the Gulf of Mexico exploded, causing the release of approximately 500 thousand tons of crude oil into the ocean in the second largest oil spill in global history, commonly known as the BP oil spill (Fingas, 2013). This spurred constant media coverage of the spill itself, as well as the cleanup. Oil spill cleanup generally includes several main steps: first the spill is contained using booms, then oil is absorbed on a large scale and skimmed off the ocean surface using boats and large amounts of absorbent materials (often more booms), and finally materials called sorbents are added to the water to remove trace amounts of oil not visible to the naked eye. What was unique about the cleanup of the Deepwater Horizon spill was the incredibly high amount of compounds called dispersants used before and during the official cleanup. Dispersion is when fine droplets of oil are transferred into the water column by wave action or turbulence (Fingas, 2013), removing oil from large slicks at the surface and allowing it to diffuse into deeper parts of the ocean. Dispersants are compounds usually sprayed on oil slicks that promote the formation of small droplets of oil, making dispersion much easier when waves stir up the oil. BP’s heavy use of dispersants was very controversial because dispersants had never been used on such a large scale before. Scientists were uncertain about two main things: 1) the effectiveness of dispersion as a cleanup method, and 2) the potential toxicity of dispersants on their own and/or mixed with oil. Since 2010, a significant amount of progress has been made in determining the effectiveness and toxicity of dispersants.

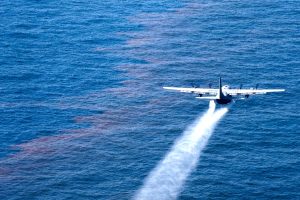
An airplane spraying dispersants over an oil slick in the Gulf of Mexico (Source: Wikimedia Commons)

An airplane spraying dispersants over an oil slick in the Gulf of Mexico (Source: Wikimedia Commons)

The petroleum industry is confident that dispersants are helpful in cleaning up oil spills (Schrope, 2013). Independent scientists, however, have not found data on the subject to be quite as conclusive. The effectiveness of dispersants depends on a variety of factors, including the type of oil, wave energy, and the amount of dispersant added. Dispersants are never 100% effective, meaning they never cause 100% of the oil from an oil slick to disperse, and even after the initial dispersal has occurred oil can often resurface within a day or so to reform the slick (Fingas, 2013). A study funded by Exxon Mobil describes a very optimistic outlook on the effectiveness of dispersants, saying that oil degrades faster when dispersed than when on shore (degradation by bacteria can occur within a matter of weeks when dispersed, according to the study) and that despite the fact that the dispersants have been shown to remove close to 50% of the oil from an oil slick in EPA-approved lab tests, they remove closer to 95% of oil in large wave tank experiments, leading Exxon’s scientists to believe that EPA estimations of effectiveness greatly underestimate effectiveness in the field (Prince, 2015). Biodegradation is a term that describes the degradation of a material by bacteria, and it is an important concept in relation to the effectiveness of dispersants. Petroleum companies argue that the increased surface area of the oil provided by dispersants allows bacteria greater access to the oil, and therefore biodegradation can occur more quickly (Prince, 2015). However, this assessment does not take into account other materials like tar that are not so easily degraded by bacteria or dispersed. Furthermore, each species of bacteria that can use oil as a food source “can utilize only a few related compounds at most, [so] broad-spectrum degradation does not occur.” (Fingas, 2013) Since degradation is not complete, dispersed oil can then be sequestered at the bottom of the ocean in association with marine snow (organic materials that rain down to the deepest parts of the ocean from the surface). In the presence of dispersants, the amount of marine snow increases dramatically and includes droplets of oil, creating an oily sludge along the ocean floor that is not being degraded by bacteria (Justine S. van Eeenennaam, 2016).

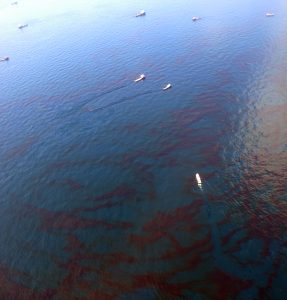
An oil slick untreated by dispersants being cleaned up by skimmer boats. The oil appears very dark and dense from the surface. (Source: Wikimedia Commons)

An oil slick untreated by dispersants being cleaned up by skimmer boats. The oil appears very dark and dense from the surface. (Source: Wikimedia Commons)

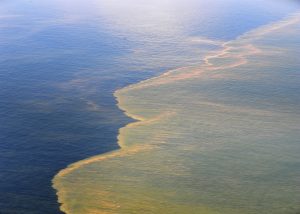
An oil slick treated by dispersants. The color of the oil slick appears much lighter from the surface, as a lighter or coffee-colored oil slick is typical of the appearance of dispersed oil. Shown here May 6, 2010, is an aerial view of the Deepwater Horizon oil spill off the coast of Mobile, Ala., taken from a U.S. Coast Guard HC-144 Ocean Sentry aircraft. (U.S. Navy photo by Mass Communication Specialist 1st Class Michael B. Watkins/Released)

An oil slick treated by dispersants. The color of the oil slick appears much lighter from the surface, as a lighter or coffee-colored oil slick is typical of the appearance of dispersed oil. May 6, 2010, is an aerial view of the Deepwater Horizon oil spill off the coast of Mobile, Ala., taken from a U.S. Coast Guard HC-144 Ocean Sentry aircraft. (U.S. Navy photo by Mass Communication Specialist 1st Class Michael B. Watkins/Released)

Not only is this sludge problematic because it is stopping the biodegradation of the oil touted by Exxon’s study, but it is toxic to the organisms that become buried below it (Justine S. van Eeenennaam, 2016). Toxicity of dispersants is a major concern, and several studies have shown that dispersants can compound a toxic situation created by the initial oil spill. First, increased biodegradation is promoted as an ideal solution for oil cleanup facilitated by dispersants, but “the aquatic toxicity of the biodegradation products is sometimes greater than that of the parent compounds,” (Fingas, 2013) so while the dispersants themselves are less toxic than oils by a magnitude of ten (Fingas, 2013), (Prince, 2015), they facilitate the production of more toxic compounds. The Exxon study also claims that dispersants show neither androgen nor estrogen receptor activity (Prince, 2015), meaning that they do not have any effect on regular endocrine function of organisms that consume or come in contact with them. While this is true for the dispersants used in the Deepwater Horizon spill, it is certainly not true for all dispersants (Richard S. Judson, 2010). Many dispersants have also been shown to be lethal to cells in culture, suggesting that they are toxic to larger animals as well (Richard S. Judson, 2010), and they can persist in the water column for years, rather than break down quickly as predicted (Helen K. White, 2014). In short, dispersants are not innocuous tools for cleanup, but have significant environmental effects that cannot be ignored.

The main benefit of dispersants is that their use can prevent large slicks of oil from contaminating coastal ecosystems and adversely affecting sensitive species like sea birds. However, “the use of dispersants remains a trade-off between toxicity to aquatic life and saving birds and shoreline species.” (Fingas, 2013) No matter what, introducing oil to an ecosystem will adversely affect that ecosystem. Because biodegradation is a questionably effective method of oil removal from marine ecosystems, the use of dispersants is essentially humans choosing which ecosystems should be more or less adversely affected, and since we see and interact with coastal ecosystems far more than deep ocean systems it is no surprise that dispersants are used to protect coastlines. However, the ecological impact of degrading deep water ecosystems should not be underestimated, and the effect of dispersants should be monitored long-term to determine whether they should be used again.

Works cited

Fingas, M. (2013). The Basics of Oil Spill Cleanup (3 ed.): CRC Press.

Helen K. White, S. L. L., Sarah J. Harrison, David M. Findley, Yina Liu, Elizabeth B. Kujawinski. (2014). Long-Term Persistance of Dispersants following the Deepwater Horizon Oil Spill. Environmental Science and Technology Letters, 1(7), 295-299.

Justine S. van Eeenennaam, Y. W., Katja C.F. Grolle, Edwin M. Foekema, AlberTinka J. Murk. (2016). Oil spill dispersants induce formation of marine snow by phytoplankton-associated bacteria. Elsevier, 104, 294-302.

Prince, R. C. (2015). Oil Spill Dispersants: Boon or Bane? Environmental Science and Technology, 49(11), 6376-6384.

Richard S. Judson, M. T. M., David M. Reif, Keith A. Houck, Thomas B. Knudsen, Daniel M. Rotroff, Menghand Xia, Srilatha Sakamuru, Ruili Huang, Paul Shinn, Christopher P. Austin, Robert J. Kavlock, David J. Dix. (2010). Analysis of Eight Oil Spill Dispersants Using Rapid, In Vitro Tests for Endocrine and Other Biological Activity. Environmental Science and Technology, 44(15), 5979-5985.

Schrope, M. (2013). Researchers debate oil-spill remedy: oil industry maintains that dispersants should be part of routine response to deep-water blowouts. Nature, 461.

How the geographic range characteristics of a species can affect its conservation

By Elana Rusnak, SRC intern

For many of us scientists, our end goal is conservation of our target species. But what does this mean, and how do we reach these goals? Unfortunately, the answer to this question is not cookie-cutter and requires the input of multiple factors that are not so easily or frequently studied.

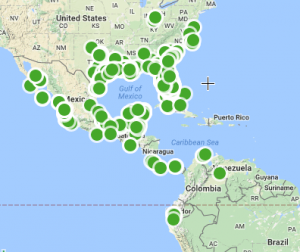
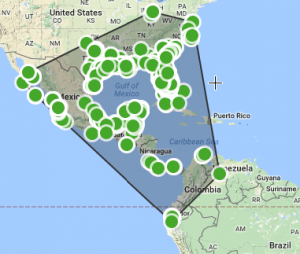
At the largest scale, the two broad measurements of geographic range can either provide too much or too little area to be taken into account with regards to protecting a certain species: the extent of occurrence (EOO) and the area of occupancy (AOO). The area of occupancy is all the local area in which a species has been recorded, but only accounts for those localized areas. It may not take into consideration the other hospitable habitat in which individuals simply haven’t been recorded yet. The extent of occurrence is generally larger; as it encompasses all of the area a species could possibly live in, including the space between the recorded individuals (Gaston, 1991). The debate between area of occupancy and extent of occurrence may yield different results, which could cause complications especially with policymakers. While it may seem ideal to cover as much habitat as possible in order to protect a species, it is expensive and requires a lot of enforcement, therefore making it difficult for policymakers to go only on extent of occurrence, since it might include habitat in which the species does not ever reside. However, it also might include area in which a species is migrating, but only during a small part of the year. Why would they want to spend valuable resources to protect an area that does not need to be protected? For example, the White Ibis has year-round populations along the coast of the southern United States and Mexico, as well as a population in northern South America. They are migratory birds, and spend part of the year more inland in the United States, yet it is only a few months of the year (The Cornell Lab of Ornithology, n.d.). If these birds were to become endangered, it is likely that there would be conflicts in determining how much of the yearly range should be protected and why.

The area of occupancy of the White Ibis (Eudocimus albus) (http://geocat.kew.org/editor)

The area of occupancy of the White Ibis (Eudocimus albus) (http://geocat.kew.org/editor)

The extent of occurrence of the White Ibis (Endocimus albus) (http://geocat.kew.org/editor)

The extent of occurrence of the White Ibis (Endocimus albus) (http://geocat.kew.org/editor)

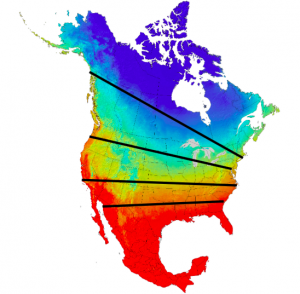
Another factor determining the geographic range is it’s shape. The shape of the geographic range generally constrained from the North and South, or from the East and West. North-South constraints are frequently controlled by the macroclimate (ex. temperature and precipitation), whereas East-West constraints are controlled by topography and availability of suitable habitat (Brown et al., 1996).

Habitat controlled by macroclimate, creating North-South constraints

Habitat controlled by macroclimate, creating North-South constraints

Habitat controlled by topography, creating East-West constraints

Habitat controlled by topography, creating East-West constraints

A problem in present times stems from climate change, which may alter the range shape due to rising temperatures. If a northern bird’s climate suddenly becomes too warm to endure, they may move north in order to compensate. If they were protected in their original habitat, however, the protected area may not cover their new habitat, which may result in population losses. A study done by Møller et al. in 2002 indicates just that: rapid climate changes are associated with dramatic population loss of migratory birds in the Northern Hemisphere. This can be a difficult situation for policymakers, especially if the population is both moving and declining at rapid rates.

Brown et al. further describes the issues of range size and boundary by commenting on the fact that the range edge is never defined. The internal populations of a geographic range tend to be steadier, with larger, constant populations. However, the outer edges of the range are mercurial, which makes it very difficult to determine. This brings us back to the extent of occurrence vs. area of occupancy issue. While individuals are seen at the borders of ranges, or in an excluded area, it does not necessarily mean that they are within the “geographic range” of their species. Since the edges change constantly, policymakers generally need to decide if they want to protect the bulk of the population, or the entire area that they cover.

At the smallest of scales, genetics also plays a role in conservation. While species can change and evolve into different species over very long periods of time, the genetic analysis tools we have today can show that what we thought was one species is actually two. For example, the California newt (Taricha torosa) was divided into two species in 2007. The newts living on the coast keep their Latin name, while the separate species living in the sierra has been named Taricha sierrae. (Kutcha, 2007). Modern speciation events like this can also have an effect on policy. If both species are endangered, policymakers would need to protect both species instead of just the one beforehand, which leads to more money spent and another proposal to be passed.

It is no wonder, now, that policymakers take so long to get a species protected. The factors discussed above are only a few of the considerations they must take into account in order to pass a proposal supporting protecting part of, or the entire geographic range of a species. With all that being said, every bit of science contributing to conservation is important science, which is why we do it.

Literature cited

Brown, J. H., Stevens, G. C., & Kaufman, D. M. (1996). The geographic range: size, shape, boundaries, and internal structure. Annual review of ecology and systematics, 27(1), 597-623.
Gaston, K. J. (1991). How large is a species’ geographic range?. Oikos, 434-438.
Møller, A. P., Rubolini, D., & Lehikoinen, E. (2008). Populations of migratory bird species that did not show a phenological response to climate change are declining. Proceedings of the National Academy of Sciences, 105(42), 16195-16200.
Shawn R. Kuchta (2007). “Contact zones and species limits: hybridization between lineages of the California Newt, Taricha torosa, in the southern Sierra Nevada”. Herpetologica. The Herpetologists’ League. 63 (3): 332–350. doi:10.1655/0018-0831(2007)63[332:CZASLH]2.0.CO;2.
The Cornell Lab of Ornithology. (n.d.). White Ibis. Retrieved March 25, 2017, from https://www.allaboutbirds.org/guide/White_Ibis/id

Threats facing South Florida’s coral reefs and possible solutions

By Molly Rickles, SRC intern

Coral reefs are dynamic ecosystems that harbor a quarter of all marine species while only occupying 0.2% of the world’s oceans (Chen, 2015). Coral Reefs are critical to the ocean’s health because of their biodiversity and complex ecosystems. However, climate change and anthropogenic disturbances has had a profound effect on coral reefs worldwide, with many reefs losing over 50% of their coral cover in the last 40 years (Baker, 2014). This is due largely to coral bleaching, a stress response induced by higher temperatures and excess nutrients. Bleaching is episodic, and the most severe events are coupled ocean-atmosphere events (CITE). Increased sea surface temperature causes coral cover to decrease when the temperature is higher than 26.85 degrees Celsius (Chen, 2015). Coral bleaching causes an increase in coral diseases as well as loss of habitat for many marine species. This eventually leads to a decrease in coral cover, which can disrupt the marine ecosystem and negatively impact the environment.

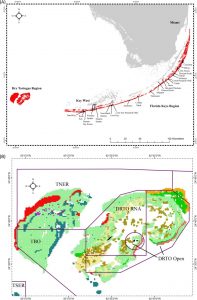
This map shows the location of South Florida’s reef system, which travels all the way down into the Florida Keys. The second image shows Dry Tortugas National Park, TNER is Tortugas North Ecological Reserve, TSER is Tortugas South Ecological Reserve, TBO is Tortugas Bank Open and DRTO is Dry Tortugas National Park. (Ault, 2013)

This map shows the location of South Florida’s reef system, which travels all the way down into the Florida Keys. The second image shows Dry Tortugas National Park, TNER is Tortugas North Ecological Reserve, TSER is Tortugas South Ecological Reserve, TBO is Tortugas Bank Open and DRTO is Dry Tortugas National Park. (Ault, 2013)

In addition to coral reefs being ecologically important, they are also economically important. Reefs generate $29.8 billion in global net benefit per year (Chen, 2015). Climate change has caused a decrease in ecotourism, resulting in a decrease in profits from coral reefs. It is estimated that the lost value in terms of global coral reef value could range from $3.95-23.78 billion annually (Chen, 2015). In order for many coastal areas to retain this profit from the reefs, corals must be protected from the harmful effects of climate change.

Florida’s coral reefs are particularly vulnerable to the effects of climate change, due to the high population concentration around the coast and the large amount of pollution in coastal waters. Since 1960, Florida’s population has increased by 379% (Ault, 2013). In addition, Southeast Florida is the 8th most densely populated area in the US (Futch, 2011). Increased population leads to increased pollution and runoff, which can be harmful to reef systems. In addition, large infrastructure projects, pipe systems, and beach nourishment can contribute to stresses on corals, all which occur in Florida. The Florida reef system supports the tourism and fishing industries, making it commercially valuable. Without the reef system, Florida would lose two of its largest income generating industries. It is necessary to implant policies that will protect Florida’s reefs from future destruction in order to support the tourism industry as well as to protect the ecosystem.

Another threat facing South Florida’s reefs is from sewage and waste runoff. Due to an increased population, the increased amount of sewage produced is something that the septic systems are not always prepared for. This leads to excess runoff. Water, sponge and coral samples were collected off of the Southeast Florida reef tract and noroviruses were detected in 31% of samples (Futch, 2011). Runoff is particularly dangerous because of wildlife contamination, which has already been observed, but also because excess nutrients in the water cause lead to algal blooms, which can then cause coral bleaching events (Futch, 2011).

This image show various types of corals as they were placed on reefs in South Florida to test the ability of the reef to recruit new corals to add to its growth. (Woesik, 2014)

This image show various types of corals as they were placed on reefs in South Florida to test the ability of the reef to recruit new corals to add to its growth. (Woesik, 2014)

Through the use of monitoring systems all throughout South Florida and the Florida Keys, it has been determined that there has been a 44% decline in coral cover since 1996. This shows that there is a dire need to protect Florida’s reef systems. There are various strategies that have been tested to see what works to preserve coral reefs. Often times, management policies are most successful in dealing with marine ecosystems, since they are generally difficult to directly monitor. One such strategy is the use of a marine protected area (MPA). Marine protected areas are generally very successful, and reefs in MPA’s normally show an increase in size, adult abundance and occupancy rates among reef fish (Ault, 2013). This strategy is especially important in Florida because of the large fishing industry. Intensive fishing has diminished top trophic levels, which affects the entire ecosystem’s balance (Ault, 2013). With the main goal of protecting coral reefs, MPA’s also make the entire ecosystem healthier and prevent unsustainable fishing. Environmental policies that limit the number of fish taken from a reef or limit the boating activity in a certain area are very effective at limiting the human disturbances on coral reefs, and can help marine ecosystems recover from anthropogenic disturbances.

In addition, coral recruitment has been used to regrow portions of bleached reefs. This was done in the Florida Keys and Dry Tortugas National Park. However, the results were not promising. Because of already present stressors such as pollution and warm temperatures, most of the corals did not survive once they were deployed on the reef. These results indicate that coral reefs have slow recovery times after bleaching events or environmental stressors (Woesik, 2014).

Coral reefs are vital to the health of the oceans. Without them, many marine species would be critically threatened. It is necessary to protect the reefs that are alive now to ensure their survival in the future. By implementing management policies, it is possible to protect the reefs from further anthropogenic disturbances, and allow them to recover from already-present stressors. If the health of coral reefs in South Florida increase, then Florida will not only benefit economically, but ecologically with improved marine ecosystems.

Works Cited

Ault, J. S., Smith, S. G., Bohnsack, J. A., Luo, J., Zurcher, N., Mcclellan, D. B., . . . Causey, B. (2013). Assessing coral reef fish population and community changes in response to marine reserves in the Dry Tortugas, Florida, USA. Fisheries Research, 144, 28-37. doi:10.1016/j.fishres.2012.10.007

Futch, J. C., Griffin, D. W., Banks, K., & Lipp, E. K. (2011). Evaluation of sewage source and fate on southeast Florida coastal reefs. Marine Pollution Bulletin, 62(11), 2308-2316. doi:10.1016/j.marpolbul.2011.08.046

Woesik, R. V., Scott, W. J., & Aronson, R. B. (2014). Lost opportunities: Coral recruitment does not translate to reef recovery in the Florida Keys. Marine Pollution Bulletin, 88(1-2), 110-117. doi:10.1016/j.marpolbul.2014.09.017

Chen, P., Chen, C., Chu, L., & Mccarl, B. (2015). Evaluating the economic damage of climate change on global coral reefs. Global Environmental Change, 30, 12-20. doi:10.1016/j.gloenvcha.2014.10.011

Baker, A. C., Glynn, P. W., & Riegl, B. (2008). Climate change and coral reef bleaching: An ecological assessment of long-term impacts, recovery trends and future outlook. Estuarine, Coastal and Shelf Science, 80(4), 435-471. doi:10.1016/j.ecss.2008.09.003


My, What Big Teeth You Have!

By Jennifer Simms, SRC outreach intern

The word “shark” conjures up many pictures in ones’ mind. Images range from majestic swimmers in a deep, blue ocean to the lethal rows of teeth easily seen protruding when a shark swims. These teeth serve multiple purposes for both the shark and scientist alike. Scientists study the morphology of teeth, mostly in mammals, to understand how the shape of teeth provides function/purpose to an animal. Most morphological teeth studies have been conducted on the extant (living) mammals and the ancient (well preserved fossilized tooth record). And the tooth can be considered the “fork and knife” for the shark, however, not all teeth are created equal.

In 2010, Lisa Whitenack and Philip J. Motta conducted a study on both living and fossilized species of shark to unlock clues about the variability of teeth shape, structure and function. The authors pointed out that a majority of previous studies have looked at musculature and jaw movement. Whitenack and Motta focused on several goals through the paper focusing on force, cutting performance, and diet. Although the article provided insight into tooth morphology, its focus was on the results found in living sharks.

To address their goals, the authors investigated three general categories of extant teeth from ten species of sharks; 1) tearing-type, 2) cutting-type and 3) cutting–clutching-type. Through a series of tests, they compared teeth morphology and function (functional categories mentioned above) on a variety of soft and hard body prey items, such as fish (soft body) and crustaceans (hard body). Tooth performance was tested by puncture and unidirectional draw. Puncture occurs when a tooth enters at a 90 degree angle to the prey item such as during biting. Unidirectional draw assumes the tooth has already entered the prey, and involves lateral movement through tissue and may occur, for instance, during head shaking.

The results showed differences in puncturing success that occurred among a variety of prey items, indicating that not all ‘soft’ prey items are alike. In some cases, broader triangular teeth (Tooth F, H, and C shown in the chart below) were less effective at puncturing prey than narrow-cusped teeth as shown in the image below (Tooth I, A, and J). Overall, all teeth shapes were able to puncture prey, but not all teeth were designed for tearing flesh in a unidirectional draw or for holding prey in the cutting/clutching role.

Does this mean that scientists can “read” shark teeth and generally determine the function of their teeth? Yes! Here are some examples of sharks that fall into one of the three teeth groups mentioned above, tearing, cutting, cutting-clutching. The Bull, White, and Blue shark all have triangular shaped teeth with serrated edges. This shaped was proven in the article to be less effective at puncturing prey. Instead, the serrated edges of the tooth are like a steak knife and the shark to tear chunks for flesh as outlined in the unidirectional draw. On the other hand, teeth that are narrow and pointy are used for holding prey, such as slippery fish, in the mouth. Sharks with this teeth design are Lemon, Shortfin Mako, and Blacktip shark.

Perhaps now, the word “shark” will inspire the reader to take a closer look at shark teeth design, whether they are observed as fossils on the beach, seen on TV, or view in person in the wild. Practice “reading” shark teeth by using the image below and determine if the shark tooth is designed for cutting and tearing large pieces from prey or is the tooth created to hold prey, such as a whole fish, in the mouth. Those rows and rows of teeth, or fork and knife, are not created equal.

Works Cited

Whitenack, Lisa B., and Philip J. Motta. “Performance of Shark Teeth during Puncture and Draw: Implications for the Mechanics of Cutting.” Biological Journal of the Linnean Society 100.2 (2010): 271-86. Web.

A challenge for a better future: Bringing life back to dead zones

By Arina Favilla, SRC intern

The diversity of life in the ocean, from shallow reefs to deep-sea canyons, is evidence that marine species can successfully adapt to a variety of environments, including low oxygen conditions. For example, in certain places in the world, natural coastal upwelling of nutrients leads to high productivity, which depletes the dissolved oxygen in the water. In these oxygen minimum zones, the benthic fauna have adapted to extremely low levels of dissolved oxygen (0.1 ml of O2/liter) (Diaz et al. 2008). But, what happens when the environment changes drastically in a short period of time? Can the animals adapt fast enough to survive?

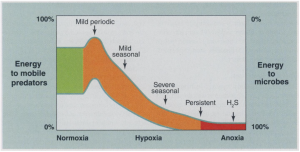
Conceptual graph of how ecosystem energy dynamics change due to changes in oxygen levels. In normal ranges (normoxia), 25-75% of energy is transferred from the benthos to higher-level organisms. As hypoxic conditions emerge, an increased amount of energy is transferred to higher-level organisms. However, the ecosystem cannot support this if hypoxia persists and eventually, microbes process most of the energy as hydrogen sulfide, which further enhances anoxic conditions (Diaz et al. 2008).

Conceptual graph of how ecosystem energy dynamics change due to changes in oxygen levels. In normal ranges (normoxia), 25-75% of energy is transferred from the benthos to higher-level organisms. As hypoxic conditions emerge, an increased amount of energy is transferred to higher-level organisms. However, the ecosystem cannot support this if hypoxia persists and eventually, microbes process most of the energy as hydrogen sulfide, which further enhances anoxic conditions (Diaz et al. 2008).

In the case of hypoxic dead zones, the answer is usually no. When hypoxic conditions (i.e. low dissolved oxygen) emerge quickly due to unnatural causes, dead zones will likely result. The low oxygen conditions can no longer support life, causing mass mortality and drastic changes in community structure (Diaz et al. 2008). Not only do hypoxic zones cause mortality of benthic fauna, but it also propagates its effects to upper trophic levels, including important commercial species (Vaquer-Sunyer et al. 2008) (Figure 1).

A major culprit contributing to the increase in hypoxic zones worldwide is eutrophication. Eutrophication occurs when river runoff brings excessive amounts of nutrients, such as nitrogen and phosphorous from agriculture fertilizers, into the ocean causing increased primary productivity, such as phytoplankton blooms. When organic matter builds up in the ecosystem faster than it can be decomposed, hypoxic conditions develop. If the physical dynamics of the area promote stratification so that the upper oxygenated water in contact with air does not mix with the bottom water, the region will be especially prone to hypoxia (Diaz 2001).

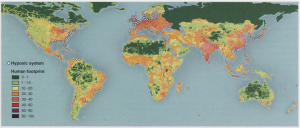
The locations of hypoxic systems match the global human footprint, which is expressed as a normalized percentage, particularly for the Northern Hemisphere where more information is available (Diaz et al. 2008).

The locations of hypoxic systems match the global human footprint, which is expressed as a normalized percentage, particularly for the Northern Hemisphere where more information is available (Diaz et al. 2008).

Hypoxic zones tend to be around coastal population centers, where the human footprint is greater (Figure 2). The number of dead zones has doubled each decade since the 1960s, now reaching over 400 zones that cover a combined area of 245,000 km2—an area as large as Oregon (Diaz et al. 2008). This is because increased population and living standards have led to agricultural and industrial needs that depend on fertilizers and/or produce other nutrients in the process (Diaz 2001).

While each hypoxic zone is unique in regards to its persistence (e.g. seasonal, periodic, or persistent) and other ambient and physical conditions, a lot can be learned from the successes and failures of one region. Declining oxygen concentrations has been observed in the Black Sea starting in the 1940s and 1950s due to the expansion of agriculture and industry, particularly in the Danube watershed (Diaz et al. 2008, Rabotyagov et al. 2014). The Black Sea hypoxic zone is part of only 8% of dead zones that experience severe, persistent hypoxia and the zone has increased from 3,500 km2 in 1973 to 40,000 km2 in the late 1980s, making it at one point the second largest hypoxic region (Rabotyagov et al. 2014, Diaz et al. 2016). This led to severe problems for the commercial bottom fisheries where only 6 of the 26 highly valued fish species were able to continue to support a fishery (Diaz 2001). It became clear that an intervention was needed—which is exactly what they did. In the early 1990s, the economies bordering the Black Sea agreed to reduce fertilizer use, and by 1995, the hypoxic zone had practically vanished (Rabotyagov et al. 2014). This case exemplifies the effects of excessive nutrients and subsequently reduced nutrient influxes on hypoxic conditions.

Eutrophication is projected to continue to increase, and climate change is expected to further exacerbate the spreading of hypoxic zones through a multitude of pathways. Models predict that climate change may increase stratification and warming, change rainfall patterns, and enhance freshwater river discharge and nutrient flux from agriculture into coastal regions (Diaz et al. 2008, further reading Altieri et al. 2014). Therefore, actions should be taken to limit the expansion of these dead zones. While it is unrealistic to reach nutrient levels of preindustrial times, more regions should attempt to reduce their nutrient inputs in hopes of seeing positive effects similar to that of the Black Sea (Diaz et al. 2008). More importantly, different states and countries must collaborate on the effort—if areas near the coast reduce their nutrient inputs while areas upstream of a river continue to contribute their same nutrient loads, the efforts of the coastal communities would be futile. The importance and sensitivity of this environmental issue is highlighted in the following quote: “There is no other [environmental] variable of such ecological importance to coastal marine ecosystems that has changed so drastically over such a short time as [dissolved oxygen]” (Diaz et al. 2008).

Just as you and I need oxygen to survive, marine organisms require sufficient amounts of dissolved oxygen in the ocean to live. Imagine hiking up to an altitude where it becomes difficult to breathe because the air is “thinner” (i.e. the partial pressure of oxygen is reduced), and feeling the symptoms of altitude sickness, which include those similar to a hangover, but never being able to come back down and recover. When marine populations are starved of oxygen, not only do they suffer, but the entire ecosystem also feels the effects, including us humans who depend on marine resources for food and much more. Therefore, finding a way to bring life back to dead zones and prevent new ones from forming is crucial to preserve our oceans.


Works cited

Altieri, A. H., & Gedan, K. B. 2014. Climate change and dead zones. Global Change Biology 21: 1395-1406.

Diaz, R. J. 2001. Overview of Hypoxia around the World. Journal of Environment Quality 30: 275.

Diaz, R. J., & Rosenberg, R. 2008. Spreading Dead Zones and Consequences for Marine Ecosystems. Science 321: 926-929.

Diaz, R., & Rosenberg, R. 2016. Threats To Coastal Ocean Sustainability: Current Status And Future Trends In Dead Zones. International Seminars on Nuclear War and Planetary Emergencies 48th Session. 

Rabotyagov, S. S., Kling, C. L., Gassman, P. W., Rabalais, N. N., & Turner, R. E. 2014. The Economics of Dead Zones: Causes, Impacts, Policy Challenges, and a Model of the Gulf of Mexico Hypoxic Zone. Review of Environmental Economics and Policy 8: 58-79.

Vaquer-Sunyer, R., & Duarte, C. M. 2008. Thresholds of hypoxia for marine biodiversity. Proceedings of the National Academy of Sciences 105: 15452-15457.