Climate Change to Cause Polar Bear Population Declines

By Laura Vander Meiden, SRC Intern

Over the next 35-40 years polar bear populations have the potential to decrease by more than 30% according to an assessment by the International Union for Conservation of Nature (IUCN). The report cites climate change and the resulting loss of sea ice as the cause of this probable decline.

Photo by Ansgar Walk vie Wikimedia Commons.

Photo by Ansgar Walk vie Wikimedia Commons.


Polar bears are specifically built to survive the harsh conditions of the arctic. Their adaptations include two types of insulating fur, a deep layer of fat to keep warm while in the water, bumps called papillae on the bottom of their feet for grip on ice, and feeding behaviors designed for living on the ice. Ironically it is these adaptations that make polar bears most vulnerable as the climate changes.

Scientist’s primary concern is the effect melting sea ice has on the eating habits of the bears. Though polar bears have been seen to opportunistically feed on a variety of organisms, their primary source of food is ring seals which live on the edge of the ice. The seals have a very high calorie content, particularly in their blubber, which is necessary for the polar bear’s frigid lifestyle. This allows the bears to build up large fat reserves which are critical as the bears can only hunt seals when there is ice. When seasonal ice melts in the summer, the bears typically must fast, living off their fat reserves, until the ice returns in the winter.

As climate change continues the ice will melt more quickly each summer and take a much longer time to return each winter. This extends the length of time polar bears must fast, resulting in higher chances of starvation. Melting ice and the subsequent reduced access to food can also lead to an overall decrease in body condition, reduced survival rates of cubs, loss of denning habitat and increased drowning as the bears attempt to swim between ice floes.

Polar bears are found on four different sea ice regions. The populations found in the region where ice is the most seasonal are at present in the most danger from climate change. Also vulnerable are populations in the divergent ice region where ice forms along the shore, but is not always connected to pack ice further out to sea. Safest are populations in the region where convergent ice connects the bears to pack ice and the archipelago region where ice remains year round. The latter region is expected to be the final refuge of the bears, but unless carbon dioxide emissions are reduced even this ice will be melted in 100 years.

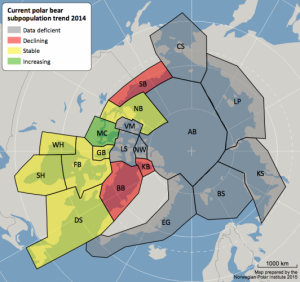
Of 19 subpopulations 3 are declining, 6 are stable, 1 is increasing, and 9 have insufficient data to make a determination. Map via Norwegian Polar Institute.

Of 19 subpopulations 3 are declining, 6 are stable, 1 is increasing, and 9 have insufficient data to make a determination. Map via Norwegian Polar Institute.

While the situation for the polar bears appears dire, scientists have not completely lost hope. If significant reductions are made in greenhouse gas emissions, the amount of time before the sea ice melts could be extended. However scientists warn that action must be taken soon, since once a tipping point is reached sea ice will decrease rapidly and no amount of emission reduction will be able to stop the ice from melting.

Why have global shark and ray landings declined: improved management or overfishing?

By Patrick Goebel, SRC Intern

A decline in shark and ray landings could be thought of as a success for in improved management strategies. However, in the case of Davidson et al (2015), that is too good to be true. Sadly, the decline in global shark and ray landings has been attributed to overfishing and other ecosystem influencers.

Sharks and rays are commercially valuable for their fins, meat, liver, oil and skin with their fins and meat in the highest demand. The demand for shark products is relatively new, as their commercial value has only increased with the decline of other valuable fisheries. The increase in fishing pressure combined with the lack of laws regulating the shark and ray fishery has resulted in population declines.

The rapid decline in shark and ray populations resulted in new management strategies. Davidson et al (2015), investigated these new management strategies to determine if declines in shark and ray catches were a result of the fisheries management performance or over.

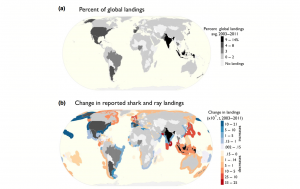
fishing. Figure 1. Global distribution of (a) country-specific shark and ray landings averaged between 2003 and 2011 and mapped as a percent of the total. (b) the difference between the averages of landings reported in 2001-2003 and 2009-2011

fishing.
Figure 1. Global distribution of (a) country-specific shark and ray landings averaged between 2003 and 2011 and mapped as a percent of the total. (b) the difference between the averages of landings reported in 2001-2003 and 2009-2011

Shark, ray, skate, and chimaera landings from 1950 (earliest years of reporting) to 2013 were investigated. In total, 126 countries shark and ray landings were modeled against indirect and direct fishing measures and fisheries management performance.

The peak of shark and ray landings was 2003 and has declined by about 20% in the past decade. As stated in Davidson et al (2015), the reduction in shark and ray landings are related to indirect and direct measures of fishing pressure rather than management implementation. This shows that sharks and rays are being harvested at an unsustainable rate. Furthermore, Davidson et al (2015), highlighted several countries that deserve prioritization for conservation and management action. The greatest declines were reported in Pakistan and Sri Lanka, both of which have little to no management. If new management strategies are not implemented into these countries, sharks and rays will continue to be harvest at damaging rate.

Davidson, Lindsay NK, Meg A. Krawchuk, and Nicholas K. Dulvy. “Why have global shark and ray landings declined: improved management or overfishing?.” Fish and Fisheries (2015).

“Blue Whales (Balaenoptera musculus) optimize foraging efficiency by balancing oxygen use and energy gain as a function of prey density” Blog Review

By Dana Tricarico, SRC Intern

Blue whales are thought to be the largest animals to have ever lived, and despite this, maintain their energy and weight through the foraging small crustaceans known as krill. Researchers at NOAA Fisheries West Coast Region, as well as Oregon State University and Stanford University looked further into their foraging behavior to find out how this species maximizes energy efficiency. In order to do this, researchers kept in mind that the densest krill patches tend to be deeper in the ocean and therefore, require more oxygen recovery time at the surface as well as less time to forage at those depths. In order to determine how blue whales feed while still maintaining their energy, these researchers compared the foraging of 55 tagged adult blue whales off the coast of California. To see the density of the krill intake from these tagged whales, acoustic surveys were used.

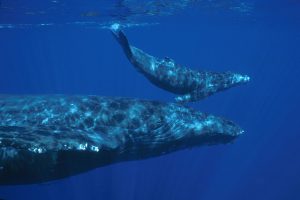
Blue whales are thought to be the largest animals to have ever lived on this planet.

A humpback whale, a relative of the blue whale

The researchers found that their feeding pattern is done by a unique form of feeding called “lunge-feeding,” i.e. High speed acceleration during feeding. This form of feeding leads to engulfment of large volumes of water filled with their prey. When krill were spread out, the blue whale’s tendency was to decrease the number of lunges per dive in order to retain their oxygen levels. In contrast, increased lunge-feeding was done when aiming for the dense krill patches despite the high oxygen use associated with deeper dives. Jeremy Goldbogen, co-author of the study, explains this trade off by saying, “the increase in the amount of energy they get from increased krill consumption more than makes up for it.” In other words, despite using a great deal of energy and oxygen, the benefits of the foraging in dense krill patches outweigh the negatives. Specifically, dense patches of krill can be classified as about 100 to 200 individuals in a cubic meter of water. Anywhere below that amount, blue whales will invest less effort.

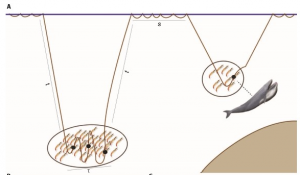
The theoretical responsive of the blue whale foraging technique created by looking at both the depth of the prey and the prey density at that depth. The right hand side of the picture shows high prey density while the left hand side shows low prey density. Different parameters are looked at in order to calculate foraging performance including time (t), bottom time, surface time (s) and number of lunges (l), which are marked by black circles.

The theoretical responsive of the blue whale foraging technique created by looking at both the depth of the prey and the prey density at that depth. The right hand side of the picture shows high prey density while the left hand side shows low prey density. Different parameters are looked at in order to calculate foraging performance including time (t), bottom time, surface time (s) and number of lunges (l), which are marked by black circles.

At present, blue whales are considered endangered by the International Union for Conservation of Nature.  Researchers of this paper state that by learning more about these foraging techniques, it can help determine how to protect these species. As Friedlaender explains, “If they are disturbed during the intense, deep-water feeding, it may not have consequences today, or this week, but it could over a period of months. There can be impacts on their overall health, as well as their fitness and viability for reproduction.” This study helps show that foraging techniques in these top predators is not random, but instead is planned depending on prey densities. Perhaps protecting them during their deep water feeding of these dense krill patches can save them further endangerment and better learn how to help them recover from threats in the future.


Innovations in controlling crown-of-thorns sea star outbreaks

By Grace Roskar, SRC Intern

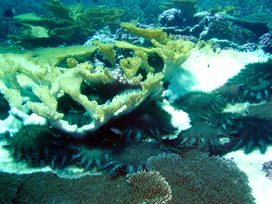
Acanthaster planci, commonly known as the crown-of-thorns sea star (COTS), are a species of sea star that can reach up to half a meter in diameter, have up to 15 arms, and therefore are one of the largest species of starfish in the world (Lucas 2013). The “crown of thorns” on the starfish refers to the sharp spines on its topside that contain a toxin that can cause and irritate puncture wounds (Lucas 2013). At normal population densities, COTS play essential roles in the food webs of coral reef ecosystems (Moutardier et al. 2015). However, when outbreaks occur and their population density greatly increases in relatively concentrated areas, COTS become a problem. Outbreaks are considered to occur when the density of COTS is over 1,500 starfish per square kilometer (Pratchett 2005). By pushing their stomachs out through their mouths on the underside of their bodies, COTS feed on and digest the live tissue of hard corals. Algae can then invade the coral and recovery of the hard coral can be inhibited. COTS can feed on an area of coral the size of its own body at a time, and due to their large size, COTS outbreaks have been considered the “most severe biological disturbance experienced by coral reefs across the Indo-Pacific, from the coast of South Africa to the Gulf of California,” (de Dios et al. 2015). For example, from 1985 to 2012, hard coral cover on Australia’s Great Barrier Reef declined from 28% to 13.8%, and COTS caused 42% of the decrease (Lucas 2013).

COTS Pic 2

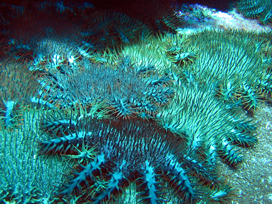
A COTS outbreak at Kingman Reef in the North Pacific. Photo Credit: Molly Timers, NOAA PIFSC (http://www.pifsc.noaa.gov/cred/crown-of-thorns_seastar.php)

A COTS outbreak at Kingman Reef in the North Pacific. Photo Credit: Molly Timers, NOAA PIFSC

In Pacific nations where these outbreaks occur, citizens often rely on the coral reefs for economic sustenance, and therefore COTS outbreaks are a “recurrent threat to food security and the coastal communities’ lifestyle,” (Moutardier et al. 2015). Although COTS outbreaks are a serious threat to coral reef biodiversity, most affected countries do not have sufficient monitoring programs to assess the outbreaks and devastation, and thus the outbreaks are not well understood (Pratchett et al. 2009). However, several methods to control outbreaks have been utilized by different nations over the years. Two relatively recent methods involve 1) using a hypersaline solution, and 2) using lime juice and acetic acid to try to control COTS outbreaks.

COTS are osmoconformers, keeping the salt concentration of their internal fluids the same as that of the surrounding seawater by allowing seawater to flow in and out through an opening on their body called the madreporite (Bradley 2009). Sea stars and other echinoderms lack excretory organs to spend energy on actively regulating their osmotic pressure, thus sudden changes in salt concentration in their internal cavity would cause physiological stress to COTS (de Dios et al. 2015). de Dios et al. (2015) studied the effect of injecting a hypersaline solution into COTS to see if this would cause physiological stress and eventually lead to death. To test this, after injection, they measured the time it took for the COTS to turn themselves from an inverted position to right-side up, called the righting response. This response has previously been used as “an indicator of sub-lethal stress” because the movement requires neuromuscular coordination (de Dios et al. 2015).

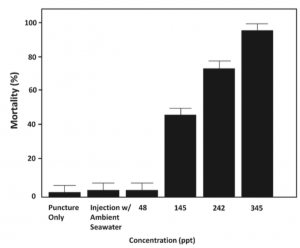
The COTS were injected with hypersaline solutions of various salinities and the time it took the COTS to right themselves was recorded.  It was found that most of the COTS remained upside down for more than fifteen minutes and were considered to be comatose. Increasing the salt concentration decreased the time it took for the COTS to become comatose. Thus, highly concentrated salt solutions (i.e. 345 ppt) had significant health effects on COTS. Increased salt solutions resulted in an increased percent of comatose sea stars, which lead to increased mortality rates. When the sea stars were injected with concentrated saline solutions, their ionic composition became unbalanced, which eventually led to their comatose state and even death (de Dios et al. 2015). Overall, the study showed that COTS cannot maintain a “large ionic gradient and large osmotic pressure at hypersaline concentrations (i.e. 145429 ppt),” (de Dios et al. 2015). Injecting hypersaline solutions is a less harmful control method compared to irritating acids (e.g. copper sulfate) that have previously been employed to control COTS outbreaks. It is also less expensive, more readily available worldwide, and is a natural product (de Dios et al. 2015).

The mortality rate of crown-of-thorns sea stars 24 hours after injection with saline solutions of various concentrations (de Dios et al. 2015).

The mortality rate of crown-of-thorns sea stars 24 hours after injection with saline solutions of various concentrations (de Dios et al. 2015).

Injecting lime juice and/or acetic acid into the sea star is another relatively newer method to control COTS outbreaks. Acetic acid is the main ingredient of household white vinegar, and lime juice contains citric acid. Moutardier et al. (2015) tested these acids on COTS because acetic acid has previously been found to kill COTS, but lime juice had not been tested before. COTS were injected with acetic acid, lime juice, or a solution of both, in various volumes, and the time it took for death to occur was recorded. Moutardier et al. (2015) found that high mortality was observed, “regardless of the solution or volume injected.” There was no significant difference between mortality from acetic acid only and mortality from lime juice only. The average time to death was 29.8 hours for acetic acid and 34.3 hours for lime juice. The study also found that double-shot injections caused death the quickest: within 24 hours for every COTS tested, under both experimental and field conditions (Moutardier et al. 2015).

The low pH of acids led to stress in the COTS, causing changes in “various physiological mechanisms and causing failure of the immune system and reproductive functions,” (Moutardier et al. 2015). The results of the study show that citric or acetic acid injections can be an effective way to kill COTS and control outbreaks. The advantages of using this method include low costs, low harm to those handling the solution, and wider worldwide availability than other acids. Fish, corals, and other benthic invertebrates in the experimental field were observed for any adverse effects from injecting nearby COTS, but no immediate or delayed effects were found (Moutardier et al. 2015). Although extensive studies have not been performed, this may suggest that the lime juice and acetic acid solutions have little to no side effects in the surrounding coral reef ecosystem.

These two innovative methods of controlling COTS outbreaks have advantages and disadvantages. Saline solutions, acetic acid, and lime juice are all inexpensive, natural materials that are widely available and are even common in most households. They are safe for humans to handle and do not require any permits to use.  However, these methods are only short-term responses to COTS outbreaks. COTS can be found at depths farther than snorkeling can occur, so SCUBA divers would be needed for injections at depth, which requires further resources from the community.

Hypersaline solution injections and acetic acid and lime juice injections are two innovative methods that have shown to be effective in killing crown-of-thorns sea stars in experimental and field trials. They are suitable for remote communities or nations with limited resources. Yet, COTS outbreaks still remain difficult to control due to size, numbers, depth, and other factors. Even with innovative efforts, outbreaks of A. planci remain a large threat to coral reef ecosystems around the world and have proven to be a difficult problem to solve.


References:

Bradley, Timothy J. “Osmoconformers.” Animal Osmoregulation. Oxford: Oxford UP,     2009. N. pag. Oxford Scholarship Online. Web. 8 Nov. 2015.         <10.1093/acprof:oso/9780198569961.001.0001>.

de Dios, Homer Hermes Y., Filipina B. Sotto, Danilo T. Dy, and Anthony S. Ilano.           “Response of Acanthaster Planci (Echinodermata: Asteroidea) to Hypersaline   Solution: Its Potential Application to Population Control.” Galaxea, Journal of    Coral Reef Studies 17 (2015): 23-30. J-Stage. Web. 8 Nov. 2015.            <http://doi.org/10.3755/galaxea.17.23>.

Lucas, John S. “Quick Guide: Crown-of-thorns Starfish.” Current Biology 23.21 (2013):   R945-946. ScienceDirect. Web. 8 Nov. 2015. <doi:10.1016/j.cub.2013.07.080>.

Moutardier G, Gereva S, Mills SC, Adjeroud M, Beldade R, Ham J, et al. (2015) Lime     Juice and Vinegar Injections as a Cheap and Natural Alternative to Control COTS      Outbreaks. PLoS ONE 10(9): e0137605. doi:10.1371/journal.pone.0137605

Pratchett, M. S., T. J. Schenk, M. Baine, C. Syms, and A. H. Baird. “Selective Coral         Mortality Associated with Outbreaks of Acanthaster Planci L. in Bootless Bay,            Papua New Guinea.” Marine Environmental Research 67 (2009): 230-36.      Elsevier. Web. 8 Nov. 2015. <doi:10.1016/j.marenvres.2009.03.001>.

Powering the World with the Energy of Water

By Kevin Reagan, SRC Intern

In recent years, as the effects of global warming and carbon emissions become more and more apparent, the need for renewable energy sources has become more critical than ever. Solar and wind power are popular sources and major investments have been increasing, especially in Europe. But both sources pale in comparison to harnessing the energy contained in moving water, known as hydrokinetic energy, which includes in-stream energy, tidal energy, and wave energy. It is estimated that the global ocean has an energy capacity of 93,100 Terawatt-hours (TWh) per year (one TWh is equivalent to 1 billion kilowatt-hours, or kWh) (Fadaeenejad 346). To put things in perspective, according to the U.S. Energy Information Administration, the average annual electricity consumption for a U.S. residential utility customer in 2014 was 10,932 kWh. In other words, 1 TWh would power roughly 91,000 homes.

Metric tons of world CO2 emissions from fuel combustion

Metric tons of world CO2 emissions from fuel combustion

Although the concept of harnessing hydrokinetic energy has been around for centuries (the first wave energy converter was patented in 1799 and as far back as the 13th century water was used to power mills) it has not been heavily researched until recently (López 414). Hydrostatic technology mainly utilized in dams, has been exploited for a long time in many countries; in the U.S. alone there are over 79,000 dams, and worldwide hydrostatic energy generation is 3,288 TWh (according to the International Energy Agency). Hydrokinetic power on the other hand is cheaper because it is not necessary to build large dams or reservoirs and there is less of an environmental impact. While the power production of a single hydrokinetic device is small-scale, they can be arranged in multi-unit arrays (similar to wind and solar farms) to increase efficiency (Güney 73). While much of the technology is still in the research and development phase, progress is being made, money is being invested, and groups like the Ocean Renewable Energy Coalition in the United States are being established.

There are two main kinds of hydrokinetic energy converters: Current Energy Converters (CECs) and Wave Energy Converters (WECs). CECs are designed to harness energy from a flowing stream (current?) through a rotating turbine, and WECs extract the energy of irregular waves by creating a system of reacting forces in multiple bodies relative to each other (Güney 75). This review will focus mainly on WECs, used to harness tidal and wave energy.

Tidal energy is one of the most easily accessible ocean power sources and can be harnessed as either kinetic energy (of the flowing water) or as potential energy associated with the water level difference between the ebb and flood periods of the tide (Soleimani 77). (Is the way I phrased it correct??) One of the most popular technologies to harness this energy is a tidal barrage situated at the mouth of a basin (bay, estuary, etc.), whose function is similar to a dam. Sluice gates open and allow water to flow into a basin. The gates then close at high tide and the tide outside the gate falls. Once there is enough of a height differential between inside the gates and out, the sluice gates open and water flows out through turbines. This process is known as ebb generation, and produces the most power compared to other current methods (Frid 134).

However, wave energy has by far the most potential for energy production.

It is a much better alternative to fossil fuels than wind and solar energy because its energy density is much higher (2-3 kW/m2 as opposed to 0.4-06 kW/m2 and 0.1-0.2 kW/m2 in wind and solar, respectively), meaning the energy contained in every meter squared of a wave is far greater than that in every meter squared of the wind or solar radiation. WECs can generate power up to 90% of the time (López 414), and it is estimated that there is anywhere from 8,000-80,000 TWh/year in wave energy capacity that can be harnessed depending on the efficiency of the technology (Fadaeenejad 346). In the U.S. alone, there is 2,640 TWh/year of energy in the coastline with 10-50 kW/m transmitted in each wave crest depending on location (Pastor 2). That is enough energy to power every home in America if it could all be harnessed.
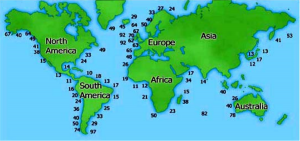
Average amount of energy (in kWh/m) in wave fronts globally

Average amount of energy (in kWh/m) in wave fronts globally

Ocean wave energy comes indirectly from the sun, as solar energy causes wind energy, which results in wave formation, and waves can travel long distance without losing very much energy. Waves are also a dependable power source that can be predicted much better/more easily than wind or solar energy. However, wave power decreases as the wave moves closer to shore due to frictional energy loss to the ocean floor. This means that offshore locations have higher energy potential than nearshore locations, but there is a tradeoff because offshore locations are more difficult to access and maintain and are subject to more extreme weather events, as well as random changes in wave direction (Chandrasekaran 140). The transmission lines would also be more expensive and difficult to maintain.
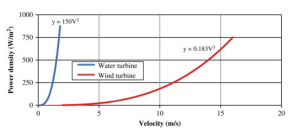
Difference in power density over different media velocities

Difference in power density over different media velocities

Since the increase in WEC research, there have been a large number of different kinds of devices developed for various types of locations. As such, these devices have come to be classified in a number of different ways: Location (inshore, nearshore, offshore), method of energy collection, and working principle. There are three main methods of energy collection currently. They are as follows:

  1. Attenuators– Long structures composed of series of cylindrical sections connected by flexible hinged joints that allow the sections to move relative to each other. They are situated parallel to wave direction.
  2. Point-Absorbers– Buoy-like structures that collect energy in all direction from the bobbing and pitching of the device.
  3. Terminators– Long structures situated perpendicular to wave direction that move up and down with the waves and capture or reflect the incoming waves.

There are four main types of working principle for WECs. They are as follows:

  1. Pressure-differentials– Uses the pressure difference between the crest and trough of a wave to generate power; these are either Archimedes Effect Converters or Oscillating Water Column converters (OWCs)
  2. Floating Structures– Floating body moved by waves who’s usable back and forth motion can be in multiple directions.
  3. Overtopping Devices– Force water to pass over the structure and fill an internal reservoir. The water is then release back into the ocean through turbines.
  4. Impact devices– Flexible structures situated perpendicular to wave motion that move back and forth with the waves.

Some of these different types are summarized in the table below (López 417-419).
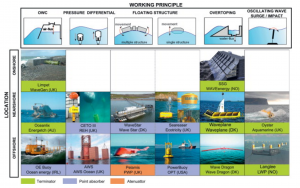
Compilation of several different classifications of WECs
Compilation of several different classifications of WECs

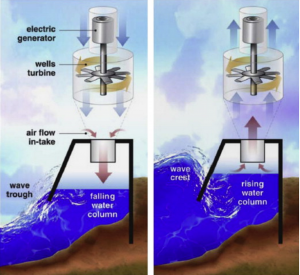
Schematic of a standard OWC converter

Schematic of a standard OWC converter

Choosing which type of converter is best for a particular location depends on a large number of variables including wave power, water depth, location, and climate; essentially, it is highly variable with some devices being very well suited for some locations and terrible for others. Research has shown that the most energy rich areas are between 40-60˚ latitude in both hemispheres, especially the Southern hemisphere where seasonal variation in weather is lower (López 415). It also depends on the environmental impact of the device. Although the negative environmental impact caused by these devices is minimal, especially when compared to hydrostatic technologies like dams, it is not nonexistent. WECs can alter mixing in the upper layers of the ocean by acting as a wave break, which can remove energy from the wave train and negatively impact ecosystem productivity and will impact reproduction if the currents are altered, as many marine species depend on currents to disperse their larvae. The noise of construction and location of the construction can also have negative environmental impacts by disturbing the species near the area and taking away habitat on the ocean floor, especially tidal barrages (Frid 136-138).

Overall, hydrokinetic technology, especially WECs, have a huge potential for the future of the world. There are several obstacles standing in the way of it becoming a feasible option to power countries, or at least coastal populations, namely lack of funding. However, wave energy also varies with the period and amplitude of the wave and can sometimes be difficult to calculate, which can mean difficulties in choosing the right type of device. As more time and money is devoted to researching new technology and increasing the efficiency of existing technology, we can move closer and closer to powering the world with the abundant, green, and most importantly renewable energy contained in our oceans and rivers. The energy has always been and will always be there; all we need to do is find the best way to exploit it.


Sources:

Chandrasekaran, Srinivasan, Deepak C. Raphel, and Sai Shree. “Deep ocean wave energy systems (DOWES): experimental investigations.” Journal of Naval Architecture and Marine Engineering 11.2 (2014): 139-146.

Fadaeenejad, M., et al. “New approaches in harnessing wave energy: With special attention to small islands.” Renewable and Sustainable Energy Reviews29 (2014): 345-354.

Frid, Chris, et al. “The environmental interactions of tidal and wave energy generation devices.” Environmental Impact Assessment Review 32.1 (2012): 133-139.

Güney, M. S., and K. Kaygusuz. “Hydrokinetic energy conversion systems: A technology status review.” Renewable and Sustainable Energy Reviews 14.9 (2010): 72-82.

López, Iraide, et al. “Review of wave energy technologies and the necessary power-equipment.” Renewable and Sustainable Energy Reviews 27 (2013): 413-434.

Pastor, Jeremiah, and Yucheng Liu. “Hydrokinetic Energy: Overview and it’s Renewable Energy Potential for the Gulf of Mexico.” Green Technologies Conference, 2012 IEEE. IEEE, 2012.

Soleimani, Kaveh, Mohammad Javad Ketabdari, and Farzan Khorasani. “Feasibility study on tidal and wave energy conversion in Iranian seas. “Sustainable Energy Technologies and Assessments 11 (2015): 77-86
Observing Invasive Lionfish Larval Dispersal Through Ocean Currents May Help to Reduce Population Size

By Dana Tricarico, RJD Intern

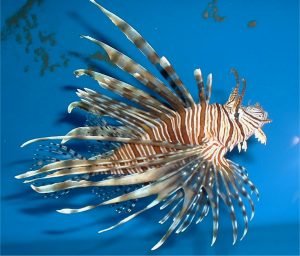
The waters of the Caribbean, Western Atlantic and Gulf of Mexico have become a hub for the invasive species called Pterois volitans and Pterois miles, more commonly known as species of Indo-Pacific lionfish. This predatory species is now an increased problem, creating negative ecological consequences to its non-native regions since 1992, when Hurricane Andrew knocked several lionfish into the waters of South Florida. According to National Geographic, they are now one of the most destructive invasive species in the Western Hemisphere and have become the first truly invasive marine fishes in the Atlantic (Albins and Mark, 2013). Since then, researchers like Dr. Matthew Johnston and Dr. Sam Purkis have been seeking ways to help manage the overabundance of this species. One major reason for the effort from scientists is due to the fact that lionfish have the potential to outcompete and prey on a large array of different types of species from all areas they inhabit. This implies that the more these species reproduce, the greater the decline of other fish recruitment, i.e. the amount of fish that survive to be added to a population (Albins and Mark, 2013).

The Indo-Pacific Lionfish is an invasive species to the Gulf of Mexico, Caribbean and East Coast of the United States. (Source: http://www.noaanews.noaa.gov/stories2006/images/lionfish-morris.jpg)

The Indo-Pacific Lionfish is an invasive species to the Gulf of Mexico, Caribbean and East Coast of the United States. (Source: http://www.noaanews.noaa.gov/stories2006/images/lionfish-morris.jpg)

At this point, it is no secret that lionfish are taking over. It is also apparent to many that consistent removal efforts are required as frequently as possible in order to try and manage the populations. This becomes more of a priority because, in addition to being ravenous predators, their reproduction rate is extremely high. In fact, one female lionfish can produce over two million eggs per year (Spencer, 2015).

Such a high frequency of spawning, with no indication as to when the next spawning period will be, leads to major complications in how to move forward in the eradication efforts. However, new research shows that there may be a way to combat issues associated with this. At this point, lionfish control is usually administered through “culls” either through local lionfish derbies, or by recreational spear or net fishing. Unfortunately, reducing the overall lionfish numbers in the invaded areas is usually unsuccessful with only these localized and sporadic derby events, which typically focus on adult fish in shallow water. The motivation of the study was to determine if local lionfish control such as those previously listed, in addition to increased removal efforts at many other locations with high larval connectivity, can help decrease lionfish biomass in downstream currents. In other words, this study wanted to look at areas where lionfish larval dispersal from one population to another was the strongest, and whether or not that could help in reducing lionfish populations (Johnston and Purkis, 2015a).

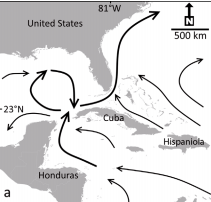
The Carolinas were chosen as the focus area for this study because dense lionfish populations had been found there from lionfish recruits, which traveled from locations like Cuba, the east coast of Florida, the Florida Keys, and other areas in which the Gulf Stream current passes through. Ten spawning areas were looked at in order to note where the lionfish from these locations eventually settled. A biophysical computer model was used in this study in order to look at the sites. This model took into consideration ocean climate data, ocean currents as well as life-history traits of lionfish to dictate the eventual settlement location of the lionfish. In addition to this model, previous research by Johnston and Purkis (2015a) showed that not only do the currents affect the dispersal of lionfish downstream of the Gulf Stream, but also hurricanes and other tropical storms can accelerate the spread of the lionfish as well due to a change in the flow of the water after these natural disasters. This is likely why the spread of lionfish was so quick after Hurricane Andrew hit the South Florida area (Johnston and Purkis, 2015b).

Ciruclation Patterns

The circulation pattern of ocean currents in the Caribbean, Gulf of Mexico and western Atlantic indicated by arrows.

Through the computer models, it was apparent how complex the linkages were between the study areas, and it was clear that there was a south-to-north flow of larvae, ending in the Carolinas. Johnston and Purkis estimated that regular removal of at least 20% of the population per month in heavily populated areas of lionfish, in addition to 20% of culling in regions upstream of large ocean currents, would be needed to effectively reduce lionfish numbers. These numbers also need to include all ages and sizes of fish, unlike the pattern typically seen in local lionfish derbies. The Caribbean, United States, Mexico, Central, and South America should all be targeted regions. The simulations also showed that Cuba exported lionfish to eight of the ten studied areas, so a significant amount of culling in both northern and southern Cuba would help in the great decline of lionfish (Johnston and Purkis, 2015a).

This study is significant to those trying to stop the ongoing invasion because it demonstrates the extreme need to introduce a more coordinated and prolonged international cooperation between nations linked via ocean currents and affected by increased lionfish populations. As Johnston states, “We’re all connected by water flow. That means one area that has uncontrolled lionfish populations can dramatically increased lionfish numbers in nations downstream (Nova Southeastern University, 2015).”


References:

Albins Mark A., and Mark A. Hixon. Invasive Indo-Pacific lionfish Pterois volitans reduce   recruitment of Atlantic coral-reef fishes.” Marine Ecology Progressive Series 367:233–238 (2013).

Johnston, Matthew W., and Sam J. Purkis. “A Coordinated and Sustained International Strategy Is Required to Turn the Tide on the Atlantic Lionfish Invasion.” Marine Ecology Progress Series Mar. Ecol. Prog. Seri. 533 (2015a): 219-35.

Johnston, Matthew W., and Sam J. Purkis. “Hurricanes Accelerated the Florida-Bahamas Lionfish Invasion.” Glob Change Biol Global Change Biology 21.6 (2015b): 2249-260.

Nova Southeastern University. “More strategic culling needed to reduce lionfish invasion, researchers find.” ScienceNews. ScienceDaily, 11 August 2015.

Spencer, Erin. “Fighting Back Lionfish for Invasive Species Awareness Week.” Voices Explorer Journal. National Geographic, 24 Feb. 2015. Web. 22 Mar. 2015.


Utilizing Crittercams to Study Animal Behavior

By Christopher Brown, RJD Intern

Two traditional techniques utilized by scientists to study animal behavior include observing wildlife species held in captivity and observing wildlife species in their natural habitats. However, there are limitations to both techniques. Animals that are held in captivity may not exhibit the same behaviors of individuals from the same species observed in the wild, and certain wildlife species may even adopt new behaviors while being held in captivity. Animals that are observed in their natural habitats may never become fully habituated with human observers, may practice specific behaviors that are difficult to observe due to climatic conditions or geographic location, or may be to elusive for scientists to locate. One of the greatest limitations scientists face is the physical inability to follow and observe wildlife species throughout a marine environment for extended periods of time.

Roughly forty years ago, marine scientists began attaching instruments to marine vertebrates in order to assess habitats, behavior, and physiology in marine environments. The instruments collected data on diving behavior using Time Depth Recorders (TDR), location and geographic range using radio satellite and GPS, and foraging and physiology using stomach temperature and heart rate monitors (Marshall, 1998). Even though each of these instruments collected useful information on habitat use, behavior and physiology, marine scientists were still left to infer behavior due to the inability to directly observe marine vertebrates in their natural environments.

In 1986, marine biologist and filmmaker Greg Marshall was diving off the coast of Belize when a shark approached him. The encounter was brief, and the shark quickly swam away, but not before Greg noticed a remora attached to the shark’s stomach. Greg was inspired to build a camera that could take the place of the remora, and provide scientists with the ability to observe the shark’s behavior for extended periods of time with only brief intervals of human contact. In 1987, Greg Marshall deployed the first National Geographic Crittercam on a sea turtle. The sea turtle behaved normally following the attachment of the Crittercam, indicating that the newly designed device had the potential to advance animal behavior research on a multi-species scale.

Screen Shot 2015-11-21 at 1.04.21 PM

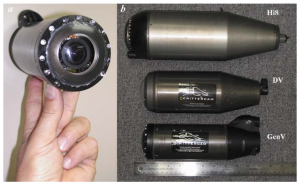
a) Frontal view of a GenV Crittercam system b) Size comparison between GenV, digital video, and Hi8 Crittercam systems (Marshall, 2007).

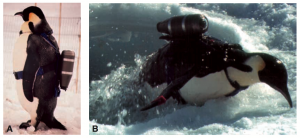
Crittercam is an animal-borne image documenting and data logging system that allows marine scientists to collect video footage and environmental data for studying the behavior and ecology of marine vertebrates (Marshall, 1998). The Crittercam has been utilized to study the behaviors of sea turtles, sharks, penguins, whales, seals and sea lions (Marshall, 2007). Various techniques are used to temporarily attach the Crittercam to different wildlife species (Marshall, 2007). Epoxy patches are used to attach the Crittercam to pinnipeds and hard-shelled sea turtles. Suction cups are used to attach the Crittercam to whales, dolphins, and leatherback sea turtles. Clamps are used to attach the Crittercam to the dorsal fin of sharks, and a backpack harness has been used to strap the Crittercam to a penguin. Crittercams that are attached to marine vertebrates record all the video footage and environmental data within the device’s memory system, which means that scientists must retrieve the deployed Crittercam in order to access the collected information. The length of deployment depends on the specific research project and species being studied, and can last anywhere from several hours to several weeks. Before deployment, the computer system inside the Crittercam device is programmed to trigger a release mechanism at a specific time, under specific environmental conditions, or after a specific amount of video footage and data has been collected (Marshall, 2007). The Crittercam is then tracked and retrieved using the device’s onboard radio beacon.

Screen Shot 2015-11-21 at 1.18.58 PM

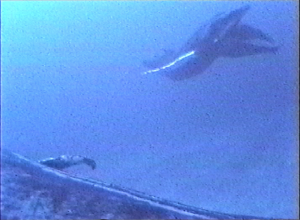
View of a secondary escort Humpback Whale, inflating his pleats along the seafloor, from a Crittercam attached to the principal escort Humpback Whale (Herman, Elia YK, et al., 2007)

The video footage and environmental data collected by Crittercams has allowed marine scientists to further study the habitat use, foraging, reproductive and social behaviors, interspecific competition and other behavioral parameters of free-swimming marine vertebrates. Ponganis, P. J., et al. utilized a Crittercam to study the sub-ice foraging behaviors of emperor penguins trained to wear a harness. Video footage and depth profile recordings from an isolated dive hole revealed that the emperor penguins repeatedly dove to shallow depths (<50 meters), before ascending to the underside of the ice sheet to feed on fish (Ponganis, P. J., et al., 2000). At the end of each feeding interval, which lasted anywhere from one to several minutes, the emperor penguins again descended to shallow depths (<50 meters) before returning to the exit hole. An additional study by Herman, Elia YK, et al. utilized a Crittercam to study the competitive behaviors of humpback whales on their hawaiian wintering grounds, observing diving behaviors and micro-interactions between humpback whales deep below the ocean’s surface. Video footage revealed a variety of reproductive and social behaviors between primary and secondary escort humpback whales competing for a single female at depths >150 meters, including the inflation of pleats along the seafloor, threats, body strikes, and chasing (Herman, Elia YK, et al., 2007).

Screen Shot 2015-11-21 at 1.03.09 PM

a) A backpack harness is used to attach a Crittercam to an Emperor Penguin b) An Emperor Penguin emerging from a dive hole wearing a Crittercam (Penguins, P.J., ET AL., 2000)

The research performed by Ponganis, P. J., et al. and Herman, Elia YK, et al. demonstrates that the Crittercam can be successfully deployed in extreme marine environments, ranging from artic conditions to ocean depths that are inaccessible to human observers. The Crittercam is an advanced piece of technology that, as it is further improved and developed, will allow marine scientists to continue studying animal behavior and ecology in more complex and dynamic marine environments. Currently, the application of Crittercams is limited to the size of the organism and species being studied. Therefore, Crittercams will become more applicable to a broader range of species as smaller animal-borne image documenting and data logging systems are designed and created.


References:

Herman, Elia YK, et al. “When whales collide: CRITTERCAM offers insight into the competitive behavior of humpback whales on their Hawaiian wintering grounds.” Marine Technology Society Journal 41.4 (2007): 35-43.

Marshall, G. J. (1998). Crittercam: An animal-borne imaging and data logging system. Marine Technology Society.Marine Technology Society Journal, 32(1), 11.

Marshall, Greg, et al. “An advanced solid-state animal-borne video and environmental data-logging device (“CRITTERCAM”) for marine research.” Marine Technology Society Journal 41.2 (2007): 31-38.

Ponganis, P. J., et al. “Sub-ice foraging behavior of emperor penguins.” Journal of Experimental Biology 203.21 (2000): 3275-3278.

Rearranging the tree of life: a closer look at Ctenophores

By Shannon Moorhead, RJD Intern

At first glance, members of the animal phylum Ctenophora don’t look like much.  Commonly known as the comb jellies, ctenophores vaguely resemble true jellies of the phylum Cnidaria: marine organisms with translucent, gelatinous bodies that spend the majority of their time suspended in the water column.  Like cnidarians, comb jellies utilize tentacles with specialized cells to capture prey, usually zooplankton and animal larvae.  However, instead of nematocysts, stinging cells typical of jellyfish and anemones, to subdue prey, ctenophores have developed colloblasts, cells found in no other metazoan, animal, group (Ryan et al. 2013).  These colloblasts produce a glue-like substance; the animal extends its tentacles, colloblasts adhere to plankton passing by, and then the tentacles are retracted and food particles are moved to the mouth (Moroz et al. 2014).  Ctenophores also have a relatively uncommon form of locomotion for metazoans of their size.  Comb jellies propel themselves by beating hair-like cilia, arranged into eight tracts called comb rows, in unison.  The comb rows run the length of the animal, from the aboral to oral surface (side of organism without and with mouth, respectively) and their beating is controlled by the aboral organ, a primitive brain consisting of sensory apparatuses for gravity, balance, and light (Moroz 2015).  This is one major component of a fairly complex nervous system that also includes two nerve nets, nerves for controlling the tentacles, and basic mechano- and chemoreceptors, sensory cells that take in physical and chemical information, respectively, from the surrounding environment (Moroz 2015).  With such complicated methods of hunting and locomotion, it is no surprise that ctenophores need an extensive nervous system to effectively coordinate various parts of the body.

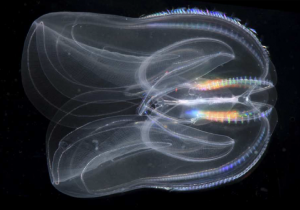
An adult Mnemiopsis leidyi, a representative member of the ctenophore phylum (Ryan et al. 2013)

An adult Mnemiopsis leidyi, a representative member of the ctenophore phylum (Ryan et al. 2013)

The fragile nature of ctenophores makes them hard to work with and, coupled with their lack of fossil record and available genomic data, they have been difficult to place on the phylogenetic tree of life.  Trees based on a variety of aspects, from morphological characteristics to ribosomal RNA analysis have placed ctenophores in a plethora of groups.  However, recent genomic analysis, coupled with analysis of the nervous system, supports a new location of ctenophores on the tree of life: as the sister group to all other Metazoan.  This would imply that comb jellies were the first group of animals to branch off on its own, and may mean that they are the closest living possible representation of the ancestral metazoan all animal life evolved from.

Previously proposed phylogenetic groupings of major metazoan lineages. Ct, Ctenophora; Po, Porifera; Tr, Placozoa; Cn, Cnidaria; Bi, Bilateria (Ryan et al. 2013)

Previously proposed phylogenetic groupings of major metazoan lineages. Ct, Ctenophora; Po, Porifera; Tr, Placozoa; Cn, Cnidaria; Bi, Bilateria (Ryan et al. 2013)

When thoroughly examined, stark differences between the genome, nervous system, and development of ctenophores and other metazoan groups (particularly those with nervous systems, bilateria and Cnidaria) can be found.  In their 2013 study, Ryan et al. sequenced the genome of the ctenophore Mnemiopsis leidyi, and determined that gene content data substantially supported the position of Ctenophora as a sister group to other animals.  Genomic analysis of the ctenophore Pleurobrachia bachei by Moroz et al. in 2014 had similar findings.  Notably, several genes known to contribute to development and patterning, the processes by which undifferentiated cells become specific structures during the growth of an organism from zygote to larva to adult, in other metazoans are completely absent.  For example, HOX genes, which are essential for controlling the body plan of bilaterians during development, are missing from ctenophores (Moroz 2015).  Not surprisingly, Moroz et al. 2014 found that Pleurobrachia express a multitude of genes not present in other metazoans early on in their development, suggesting ctenophores may have evolved an entirely unique set of development and patterning genes.

Comb jellies also have a variety of unique innovations, as well as the absence of usually essential metazoan genes, that indicate the independent evolution of their nervous system.  Moroz 2015 found the neurons of ctenophores had a non-polarized morphology: any part of the neuron can form a synapse onto another cell, far different from the typical bilaterian neuron with its signal-receiving dendrites and signal-sending axon.  Neuronal cell structures also form a “presynaptic triad”, a way of organizing the area of the neuron that sends transmits the signal to another cell that is unique to ctenophores (Moroz 2015).  Microscopy reveals a row of diverse, similarly-sized vesicles containing neurotransmitters just under the cell membrane, nearest to the synapse.  Behind the row of vesicles is a layer of smooth endoplasmic reticulum, followed by one or several large mitochondria.

(A) drawing of an asymmetrical synapse with presynaptic triad. (B) Two-way synapse, with opposing presynaptic triads. (C) Asymmetrical synapse. (D) Soma-soma reciprocal synapse. c.v, cytoplasmic vesicles; e.r., endoplasmic reticulum; g, Golgi complex; M, mesoglea; mi, mitochondrion; mt, microtubules; r, ribosomes; s.v., synaptic vesicle (Moroz 2015).

(A) drawing of an asymmetrical synapse with presynaptic triad. (B) Two-way synapse, with opposing presynaptic triads. (C) Asymmetrical synapse. (D) Soma-soma reciprocal synapse. c.v, cytoplasmic vesicles; e.r., endoplasmic reticulum; g, Golgi complex; M, mesoglea; mi, mitochondrion; mt, microtubules; r, ribosomes; s.v., synaptic vesicle (Moroz 2015).

Observations of ctenophores via microscope also show they have a high diversity of synapses compared to other metazoa, though the most prevalent is the asymmetrical synapse.  The asymmetrical synapse is polarized, like in bilaterians, with one cell sending and one receiving a signal; the abundance of this type of synapse indicates that comb jellies primarily use unidirectional chemical transmitters to send a message from a neuron to another neuron, or another kind of cell (Moroz 2015).  Ctenophores also utilize soma-soma reciprocal synapses, where cells synapse onto each other at staggered locations, and two-way synapses, which are not found in vertebrates.  These two-way synapses involve the presynaptic triads of two neurons facing each other, meaning that signals are being transmitted in both directions across the synapse (Moroz 2015).  In addition to chemical synapses, ctenophores have gap junctions, electrical synapses formed by a protein connecting the cytoplasms of adjacent cells.  Moroz 2015 found that Pleurobrachia make twelve different gap junction proteins, though not connexin, the one most commonly used in chordates.  These gap junctions are most common in the aboral organ, tentacles, and combs, where the quick signal transmission allows for better coordination of movements.

Evidence suggests ctenophores have adapted their own set of neurotransmitters as well.  Moroz et al. 2014 was unable to detect common metazoan neurotransmitters such as acetylcholine, dopamine, serotonin, noradrenaline, adrenaline, and nitric oxide in Pleurobrachia.  They also found no genes encoding enzymes to make, as well as no genes encoding receptors for, these transmitters.  In the study, Moroz et al. determined that L-glutamate, an amino acid, is the most likely candidate for a ctenophore neurotransmitter.  This is supported by the ability of L-glutamate to cause muscle contractions along with the unprecedented variety of ionotropic glutamate receptors (iGluRs) in comb jellies.  During ctenophore development, iGluRs become present around the same time as neurons, indicating the two are associated and further supporting the candidacy of L-glutamate as a neurotransmitter (Moroz et al. 2014).

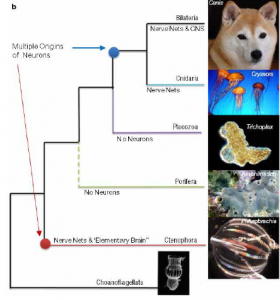
Phylogenetic tree based on recent studies, indicates the evolution of neurons at two separate points (Moroz et al. 2014)

Phylogenetic tree based on recent studies, indicates the evolution of neurons at two separate points (Moroz et al. 2014)

When examined closely, the glaring differences between the genes, development, and nervous system of ctenophores and other metazoans have significant implications for the understanding of animal evolution.  Ctenophores, and not sponges (Porifera) as previously thought, as the earliest diverging metazoan lineage would suggest that the nervous system evolved twice in metazoan groups, once in ctenophores and again in cnidarians and bilaterians.  The members of Porifera lack a true nervous system and most likely never had one; once an animal lineage has developed a nervous system it is far too valuable to lose.  This suggests that the common metazoan ancestor sponges, and also ctenophores, evolved from had not yet developed a nervous system.  If this was the case, then ctenophores and cnidarians/bilaterians had to develop nervous systems completely separately, hence the unique features of the ctenophore nervous system.  Convergent evolution of this complex a structure is unprecedented in the animal kingdom and this, along with other data gathered from ctenophores, could incite a complete reworking of the theories of animal evolution.

References

Moroz, L. (2015). Convergent evolution of neural systems in ctenophores. Journal of Experimental Biology, 218, 598-611.

Moroz, L. et al. (2014). The ctenophore genome and the evolutionary origins of neural systems. Nature, 000, 1-6.

Ryan, J. et al. (2013). The Genome of the Ctenophore Mnemiopsis leidyi and Its Implications for Cell Type Evolution. Science, 342, 1242592-1242592.


Fishery Collapses Explained by Overfishing, Life-History Traits, and Climate Variability

By Christopher Brown, RJD Intern

Species around the world have experienced significant declines below fixed thresholds that indicate the risk of extinction. Evidence has suggested that the risk of extinction runs high in terrestrial species that maintain large body sizes, feed high in the food chain, and demonstrate slow population growth rates. However, within marine ecosystems, species that exhibit fast population growth rates have been found to be just as likely to face the risk of extinction as species with slower population growth rates. Population growth rates can be understood as one of several factors that determine the risk of extinction. Additional factors that may influence the risk of extinction include climate variability and harvest dynamics. Overfishing, especially in waters unregulated by governing bodies, may play a strong role in population collapse. Recent studies have suggested that fast growing marine species subject to climate variability are more sensitive to overfishing than slow growing marine species.

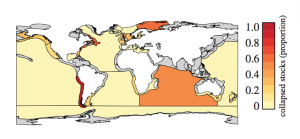
Screen Shot 2015-10-25 at 9.44.33 PM

Figure 1: Proportion of fish stocks that have ever collapsed (Gray regions represent large marine ecosystems without fish stock status information) (Pinksy and Byler, 2015).

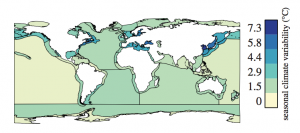
Screen Shot 2015-10-25 at 9.44.56 PM

Figure 2: Seasonal climatic variability of large marine ecosystems (Pinksy and Byler, 2015).

Pinsky and Byler used boosted regression trees to analyze the effects harvesting, species traits, and climate variability had on one hundred and fifty-four fish populations located around the world. In regards to fish and fisheries data, population collapses were analyzed using the RAM Legacy Stock Assessment Database version 1.0. This large database withholds a time-series of both population biomass and fishing pressure dating from 1950 to 2008. A fish stock was defined as collapsed if the minimum annual biomass dropped below 20% of the biomass necessary to support a maximum sustainable yield (Pinsky and Byler, 2015). The climate variability of seventy large marine ecosystems (LME) was calculated using sea surface temperatures (SST) from an 1870-2014 HadISST dataset. The SSTs were averaged monthly within each LME and the time-series were de-trended by subtracting a linear regression from each set of values. Short-term climate variability was measured to analyze the seasonal cycles, in addition to long-term climate variability. The four main questions that were addressed included (Pinsky and Byler, 2015):

  • Do the interactions of fishing with rapid growth rates contribute to population collapses?
  • Are fishery collapses more likely in regions with more variable climates?
  • Do the interactions of climate and fishing contribute to collapses?
  • What are the relative influences of fishing, life history and climate on population collapses?

Pinsky and Byler found that LMEs that had the greatest seasonal climatic variability were either enclosed, coastal areas, or located at intermediate latitudes. The most depleted fish populations in these LMEs had the greatest overfishing durations, maintained faster growth rates, and experienced a significant amount of seasonal climatic variability. Fish populations that were subject to overfishing in LMEs with great climatic variability were determined to be about twice as likely to collapse than fish populations overfished in LMEs with less climatic variability. Even though overfishing was a dominant factor in the models used to analyze fish population collapse, it was determined that life-history characteristics and climate variability predispose fish populations to collapse and depletion (Pinsky and Byler, 2015). Fast growing species have short generation times, and slow growing species have longer generation times. Fish species with short life histories are more prone to collapse, especially if there is a long delay in reducing harvest rates after population growth declines. Fish species with long life histories are able to tolerate longer delays. Because fish species with short life histories are more difficult to incorporate into sustainable fishing practices, dynamic management is needed to rapidly reduce harvest rates when it appears that a fast-growing species is approaching a collapse. Population biomasses and fishing pressures must be monitored closely enough to detect the possibility of the collapse and depletion of global fish populations in order to keep fast growing species above the fixed thresholds that indicate the risk of extinction.

References:

Pinsky, Malin L., and David Byler. “Fishing, fast growth and climate variability increase the risk of collapse.” Proc. R. Soc. B. Vol. 282. No. 1813. The Royal Society, 2015.

Living on the Edge: Settlement Patterns by the Symbiotic Barnacle Xenobalanus globicipitis on Small Cetaceans


By Rachel Skubel, RJD Intern

If you were a barnacle, how would you choose your home? For X. globicipitis barnacles residing on striped dolphins, this question was ‘put under the microscope’ by Juan Carillo and colleagues at the University of Southern Mississippi and Cavanilles Institute of Biodiversity and Evolutionary Biology (Valencia, Spain).

Of all obligate barnacles studied, X. globicipitis has been found on animals that experience the most intense currents (Bearzi and Patonai, 2010). These organisms will settle on dolphins to optimize for (a) availability of passing current, to provide food, and (b) low drag from said current, to reduce physical degradation of the animal. Here, the investigators asked the following questions:

  1. Where do these barnacles choose to settle?
  2. How does this choice affect the barnacles’ recruitment (define), survival, and growth?

The researchers examined stranded striped dolphins (Stenella coerleoalba) along 556 km of the spanish mediterranean coastline (map), from 1979 to 2009. In 1990 and 2007, many of the dolphins examined had been killed by the morbillivirus (link to http://www.nmfs.noaa.gov/pr/health/mmume/midatlantic2013/morbillivirus_factsheet2013.pdf) – infected animals would have swam slower and had weaker immune systems than otherwise, making them more likely to be colonized by the barnacles. For each animal, the researchers looked at the abundance (i.e. amount), location, and size of the barnacles. Then, they used a model to investigate why barnacles were colonizing certain locations of the dolphins.

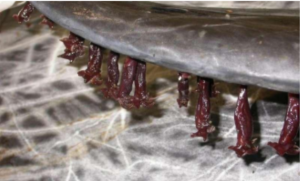
Figure 1: Barnacles were mainly found on the trailing edges of dorsal fins, flippers, and flukes, over an area ~2cm wide (Dr. Mariano Domingo, Autonomous University of Barcelona, Spain)

Figure 1: Barnacles were mainly found on the trailing edges of dorsal fins, flippers, and flukes, over an area ~2cm wide (Dr. Mariano Domingo, Autonomous University of Barcelona, Spain)

Results

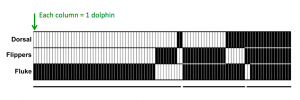
Out of 242 dolphins examined, 104 had the X. globicipitis barnacles – on either their dorsal fins, flippers, and tail flukes. Of these locations, the tail flukes were by far the most common. Even if the dolphins had barnacles in multiple locations, linear density (barnacles/cm) was significantly higher on the tail. Also, the shell size of barnacles on the flukes was higher than on the flippers and dorsal fins. For these dolphins with barnacles on their tail flukes, it was more common to find them on the dorsal (top) than ventral (bottom) size of the tail.

Figure 2: When dolphins were found with X. globicipitis barnacles, they were most likely on the caudal fin.

Figure 2: When dolphins were found with X. globicipitis barnacles, they were most likely on the caudal fin.

Dolphins thought to have died from the morbillivirus did not have any significant differences in where the barnacles were located, or their size, compared to the unaffected animals.

Explaining the trends

When interpreting these results, it was important to consider that these were all pre-deceased study subjects, and the barnacles might have even settled on the carcasses. However, the finding of tail flukes being a popular settlement area for these barnacles matches with observations in the wild (see video below).

https://www.youtube.com/watch?v=8aJdW5IRZSs

 Beginning around 0:13, you can see barnacles are common on the tails of wild dolphins, supporting the findings of the present study by Carillo et al.

How do the barnacles choose where to dig in? The researchers propose that once they’ve used chemical cues to recognize the dolphins as proper hosts, a two-pronged mechanism follows.

  • First, attachment success: those that choose the tail to latch onto will be less likely to fall off in the process because there is some shelter from strong currents. And once one barnacle settles, it actually becomes easier for more to do the same because they will be ‘sheltered’ by this first individual.
  • Second, there is less early cyprid mortality, which means that once fully attached, it is easier to stay attached.

Lastly, the authors considered why there were more barnacles on the dorsal sides of the tails. This could be due to an asymmetrical swimming style by the dolphins, which means that their ‘downstroke’ is stronger than their ‘upstroke’, so there is less force on the settled barnacles if they settle on the top of the tail. However, whether the swimming style of these dolphins is symmetrical or assymetrical is not conclusively known.


References

Bearzi M, Patonai K (2010). Occurrence of the barnacle (Xenobalanus globicipitis) on coastal and offshore common bottlenose dolphins (Tursiops truncatus) in Santa Monica Bay and adjacent areas, California. Bull South Calif Acad Sci. 109: 37–44. DOI: 10.3160/0038-3872-109.2.37

Carrillo JM, Overstreet RM, Raga JA, Aznar FJ (2015) Living on the Edge: Settlement Patterns by the Symbiotic Barnacle Xenobalanus globicipitis on Small Cetaceans. PLoS ONE 10(6): e0127367. DOI: 10.1371/journal.pone.0127367