The Three Pillars of Ecotourism

By Emily Rose Nelson, SRC Intern

Conservationists, scientists, and politicians alike are increasingly starting to understand that the natural environment can no longer be effectively managed as a separate entity from humans. We have left footprints nearly everywhere on earth and therefore, it is essential we start to factor ourselves into the equation when putting together management plans. One means of doing this, the development of ecotourism, has gained popularity in recent years. At its best, ecotourism brings people to some of nature’s most pristine areas, which then promotes conservation of wildlife and habitat, all while improving the lives of local people. At its worst, ecotourism can bring massive amounts of people to an important wildlife area, causing destruction, and completely uprooting the lives of already impoverished people. Ecotourism development, especially in developing countries, is a complicated process that requires the involvement of numerous stakeholders. Fortunately, Barnett and colleagues in fields such as fisheries science, tourism, economics, ecosystem ecology, business management, and social science have created a guide of best practices to be followed in order to create successful ecotourism in developing countries. Barnett et al. identified three main pillars of sustainability needed for ecotourism: sociocultural, environmental, and economic.

The sociocultural aspect is meant to help gain support from locals for the ecotourism project as well as identify any important social or ecological issues. This pillar needs to evaluated before anything else because without support of the locals, nothing will be affective. Bringing ideas and practices from Western society into developing countries is difficult and needs to be done carefully. Extensive research on the local culture and norms needs to be done before attempting to throw developed culture on a developing nation. For example, in the developing world fishing is often an important part of culture and considered sacred. The idea of sportfishing for pleasure, so common to our society, may be considered intrusive and rude to these people.  It is also important to understand ownership and occupancy of natural resources to avoid conflicts. Finally, adapting to tourism require a whole new social and cultural norms. Locals may be resistant to this change, even if it is providing alternatives to a struggling society. It is necessary to work with the people, provide fisherman the opportunity to work as fishing guides or complement the ecotourism with public health projects to ensure they still benefit.
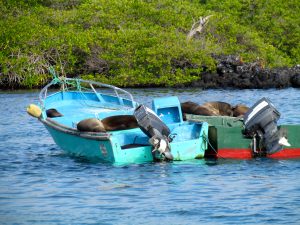
Boom and bust fishing cycles in the Galapagos Islands has led to the development of ecotourism, some of which as been very difficult on the locals.

Boom and bust fishing cycles in the Galapagos Islands has led to the development of ecotourism, some of which as been very difficult on the locals.

The second pillar, environment, can be addressed only after the local people are on board with the plan. At this point, plans need to be set in place to manage the resources and gain the necessary scientific background on the biology and ecology of them. The basic requirement underlying ecotourism is that there is an ongoing product available to attract customers. In the case of something like sportfishing, this means the continual availability of healthy fish stocks and the conservation of their habitats. In order to ensure this, detailed studies need to be done to develop baseline knowledge of the resources that can be used for effective management. Information on fishing mortality, catch handling and post-release conditions should also be gathered and incorporated into stock assessments and best practice protocols for catch and release. When developing an ecotourism, it is critical that local people support and benefit from it. Therefore, they will have a reason to abide by conservation regulations and sustain the ecosystem. Further, if the ecotourism is able to promote the long term benefits of conservation minded practices conflicting interests that are destructive will not be given priority.
The final section, economic, should ideally only be considered after the first two are going smoothly. However, in developing nations a business plan is often implemented to the ecotourism before the necessary knowledge is acquired in efforts to generate income as quickly as possible. Unfortunately, this can have detrimental impacts if it involves threatened species or ecosystems. When done properly ecotourism can have huge economic benefits for developing nations. Locals should be given as much opportunity as possible to get involved in the business. They should be given the option of employment in the ecotourism directly filling roles such as guides or mechanics and if they are not yet equipped with the necessary skills they should be given the opportunity to learn. If not working directly for the business, they could sell local goods and services to the influx of tourists to their community. Despite these opportunities, economic development sometimes comes with unavoidable costs. In order to minimize these costs access rights should be negotiated, cultural protocols should be followed, and environmental damage should be safeguarded against.
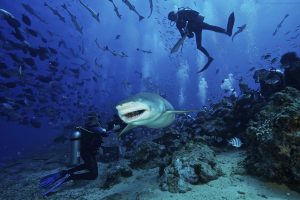
Shark Reef Marine Reserve in Fiji is a successful example of ecotourism. Here, divers pay a fee, which is distributed to local villages that have given up their fishing rights for conservation.

Shark Reef Marine Reserve in Fiji is a successful example of ecotourism. Here, divers pay a fee, which is distributed to local villages that have given up their fishing rights for conservation.

By concentrating on these three pillars of sustainability it is possible to develop effective and sustainable ecotourism. Inevitably, problems will arise throughout the creation of any ecotourism plan. Therefore, it is important to realize that this is not a one size fits all plan approach, and that the guidelines described should be used and modified to fit individual situations and change as ecotourism develops. Ecotourism models should include short term coping mechanisms as well as long-term capacity building. When all of this is done, it is possible for ecotourism to provide mutual benefits to tourists, local people, and the environment.


Reference:

Barnett, A., Abrantes, KG., Baker, R., Diedrich, AS., Farr, M., Kuiboer, A., et al. (2015). Sportfisheries, conservation and sustainable livelihoods: a multidisciplinary guide to developing best practice. Fish and Fisheries, DOI: 10.1111/faf.12140.



Integration of Indicator Alarm Signals for Ecosystem-Based Fishery Management


By Robert Roemer, SRC Intern

Taking into account different stakeholder’s priorities, while combining ecological, economic, and recreational indicators for managing sustainable fisheries have been a long-standing problem. While not a new issue, these quandaries are only compounded when opinions conflict within each ecological, socioeconomic, and recreational stakeholder class.

A recent study conducted by Duggan et al. 2015 aim to address this problem by utilizing a ‘signal detection” approach, by focusing on shifting issues of multiple indicators usually with inconsistent, conflicting units to a simpler state. In the researchers eyes, simplicity is vital to successfully managing fisheries stocks. By reducing conflicting management approaches and units to just two management options (reduce harvest rate or not reducing the harvest rate), researchers can calculate just one signal, termed the “Response Support Signal” (RSS). The Response Support Signal is derived from the complete range of indicators and opinions then quantifies the level of support to reduce, or not-reduce the harvest rate.

How did the researchers determine the RSS?

First, time series fisheries data was obtained from ICES reports for a total of nine Celtic Sea stocks. Then, 21 indicators were obtained from the literature that covered a variety of metrics like: average weight; discard rate; species evenness; and fuel costs over different time frames. From each indicator, a “status signal” was computed, with each status signal composed of two stages; (1) the indicator or “warning signal” which revealed if each indicator was beyond its threshold, and (2) if adjusting the indicator via a hypothetical change would align with the warning signal (i.e. reducing when indicator is beyond threshold and not reducing when within its threshold). From this, sets of indicator-stock combinations are formed with each having a respective status signal: Hit − (H −), Hit + (H +), Miss (M), and False Alarm (FA). From the frequency of status signals in each indicator, the true positive rate (TPR) and false positive rate (FPR) were calculated by:

TPR= N(H −) / N(H −) +N(M) and FPR= N(FA) / N(H +) + N(FA)

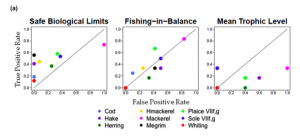
where N(x) denotes the frequency of occurrence of x. The TPR is then plotted against the FPR to determine the degree of alignment between decisions and the indicator values.

Figure 1: ROC plots where each point represents a fish stock time series. The further to the top left corner, the more often management actions were appropriate to indicator signal. Points below the line and right indicate inappropriate responses to indicator signal.

Figure 1: ROC plots where each point represents a fish stock time series. The further to the top left corner, the more often management actions were appropriate to indicator signal. Points below the line and right indicate inappropriate responses to indicator signal.


What has been concluded?

When data is pooled across stock and years, it shows historical management trends to be independent of indicator alarms. A higher occurrence of H + and M rather than H – and FA, indicates a bias of historical management practice to not reduce fishing mortality (64% of years analyzed). However, what is surprising is after investigating all eight stakeholder scenarios, it was found that all support a reduction in fishing mortality from 1980 to present, with special emphasis on the timeframe of 1990-2003.

The authors in this study identified the critical need for fisheries management to be scientifically objective, and have offered a framework that is both practical and effective for assessing a variety of indicators that are integral to the field of fisheries management. The defined RSS values include objective indicator information that harmonizes with stakeholder preferences, a valuable asset to be used for management decisions. One object of note, the authors acknowledge this tool is not necessarily intended to advise mangers to what course of action is best management, but to structure the communication and to facilitate discussion between various stakeholder groups to help achieve best practices.


Reference:

Duggan, D. E., Farnsworth, K. D., Kraak, S., & Reid, D. G. (2015). Integration of Indicator Alarm Signals for Ecosystem‐Based Fishery Management. Conservation Letters8(6), 414-423.


Lifting, Not Shifting, Baselines in the Face of Conservation Success

By Kevin Reagan, SRC Intern

Twenty years ago the term “shifting baselines” was explored and coined by a fisheries scientist named Daniel Pauly in his paper titled “Anecdotes and the shifting baseline syndrome of fisheries.” This term is used to describe the idea that with each successive generation, in this case speaking of generations of fisheries scientists, the baseline (or standard) of fish stocks, abundance, size, growth rate, etc. is what they observed in the population at the beginning of their careers. Losses before this time are not really seen as losses because the norm is what’s observed when scientists begin, and this is not necessarily the case; in most instances that number is already far below what historic levels were and not the true baseline that would describe a healthy, fully recovered population. What is even worse is that it shifts with each generation, gradually moving farther away from where it should be and being considered fine.

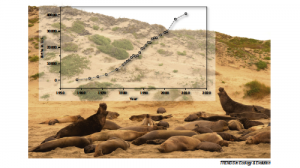
However, in recent years, certain species of animals are recovering and growing in number, eventually returning to areas they had long been absent from. This is almost always a result of the reduction/banning of commercial hunting, like the Convention on International Trade of Endangered Species, and harmful chemicals like DDT. In this paper, authors propose the idea of “lifting baselines” as part of the shifting baselines syndrome to describe and celebrate conservation success stories. In analysis of trends of 92 different marine species, 42% were increasing in number, 10% were decreasing, and the rest showed no change in status. This is not to say that this is a universal trend; huge numbers of species are still in decline and we are still in the midst of a massive extinction event. Even so, many species are doing better than before. For instance, elephant seals were almost hunted to extinction in the late 1800’s. It is estimated that as few as twenty individuals remained. But, after being protected by Mexico and the U.S. in the 1920’s, their numbers have rebounded to over 200,000 seals.

Northern elephant seal rookery on Año Nuevo Island, CA. The graph depicts the increase in the number of births of elephant seals since 1960.

Northern elephant seal rookery on Año Nuevo Island, CA. The graph depicts the increase in the number of births of elephant seals since 1960.

While the recovery of species is great news for conservation scientists, it is not always welcomed by the public, especially recovery of marine predators. Many maritime industries developed while predators were few and far between and expected them to stay that way. Now that their numbers have rebounded, people believe there to be a surplus regardless of what the numbers were before exploitation (example of shifting baselines). This can result in a call for culling (mass killing) of the animals because they’re considered a nuisance. Lifting baselines, where “successful recovery of depleted species is verified, celebrated, and understood in an ecological and historical context,” can counter this. Authors developed four basic strategic recommendations to lift baselines, develop public support, and create acceptance in the sociopolitical arena around these success stories. They are as follows:

  1. When protection works, celebrate it!

– Conservation scientists and NGO’s need to actively engage the public in monitoring and recording a species’ return to its previous historic numbers. This creates a positive attitude and a sense of responsibility for the animal’s recovery.

  1. Down/delist species that no longer require protective measures

–  Reward the efforts that reversed the species’ decline and allow the time and resources previously being used to help those species that are still in trouble.

  • Actively anticipate and manage potential and actual conflicts that are the result of range expansion and trophic interactions of recovering species.

–  Monitor ecological changes and engage stakeholders as part of the recovery strategy. Recovering species will influence other species and the food web as it assumes its role in the environment. Investigating these relationships between species of concern will help develop realistic recovery targets and management goals

  1. True costs and benefits of removing “nuisance” animals through different means must be established.

–  In general, there is very little follow-up after the removal of nuisance animals and cost-benefit analyses are almost never performed. Costs should be quantified and include both ecological and social measures. If the methods used are not cost-effective, a less destructive and invasive approach is needed

These recommendations should be put in place while the initial conservation steps are being taken. Clear and realistic recovery goals can help species move off the endangered species list and accurate estimates of costs/benefits can turn wildlife from a scapegoat to an asset. However, this will require input from more than just scientists. Economists, artists, journalists, and social scientists will all be needed for effective public outreach and conservation measures, especially to reduce conflicts between humans and endangered animals. If we all work together, we can establish conservation plans that are practical, can make a difference, and most importantly, are realistic.

References

Roman, Joe, Meagan M. Dunphy-Daly, David W. Johnston, and Andrew J. Read. “Lifting Baselines to Address the Consequences of Conservation Success.” Trends in Ecology & Evolution 30.6 (2015): 299-302. Web.


Marine Biota and The Well Being of Humans

By Melissa Soto, SRC Intern

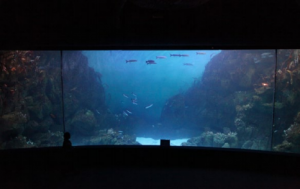
A small dose of nature can go a long way. Studies show that exposure to nature has a significant calming and stress reducing effect on humans. A recent study published in the United Kingdom examined how people’s behavior, physiological, and psychological reactions varied when exposed to an aquarium. The researchers recorded the participant’s reactions when the aquarium was unstocked (meaning no marine life), partially stocked (some marine life), and fully stocked (with plenty of marine life).

Previous research suggests that humans inherently want to be surrounded by nature. Taking place in the United Kingdom’s National Marine Aquarium, researchers wanted to see how much time people would spend in front of the large restocking exhibit along with any stress and emotional changes people experienced at the three stages of restocking.

Screen Shot 2015-10-19 at 5.47.58 PM

There are three main ways to determine stress recovery with the assistance of nature. They are the Biophilia Hypothesis, the Psychophysiological Stress Recovery Theory (PSRT), and Attention Restoration Theory (ART). Biophilia is the emotional connection humans have with nature, PRST says humans are predisposed to react positively to nature, and ART suggests that mental irritability and distraction can be reduced with a nature setting. Although these three theories apply, ART is the one that worked best with this experiment as there are four parts. Fascination, being away, extent, and compatibility all resemble what people experienced as they view an aquarium. Here are the direct examples for these four components. 1. People were fascinated as they viewed the marine life 2. The everyday setting of their life was removed 3. They had the opportunity to be educated 4. They choose to visit the exhibit.

The scientists created three different hypotheses’ and explore them. The first was to see if voluntary exposure time would reflect intrinsic fascination and be positively correlated with the level of biota present within the exhibit. Second, there would be a positive relationship between psychophysiological responses and viewing the exhibit when it contained marine life. The final hypothesis was to see if longer exposure time to the exhibit would improve psychophysiological responses.

The participants entered the aquarium and stood in front of the exhibit when it was unstocked, partially stocked and fully stocked. Each participant stood alone while the aquarium transitioned into the different conditions. Measurements were taken twice weekly at different times of the day. Following this, the participant’s psychological mood was measured based on a “The Feeling Scale”. The scale showed whether the participants had a positive mood with high arousal, negative mood with high arousal, positive mood and low arousal or negative mood with low arousal.

Participants then made their way from the aquarium into a room where their blood pressure and heart rate was monitored. Blood pressure and heart rate monitoring was conducted for a total of five-minutes. Measurements were taken at the two-minute mark and at the five minute mark.

Screen Shot 2015-10-19 at 5.49.24 PM

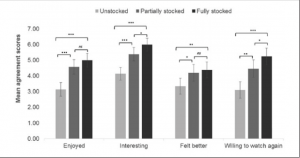
The results of this study showed that the participants stayed in front of the exhibit longest when it contained the highest level of marine life further supporting Hypothesis 1. The more biota allowed for more interest and willingness to watch. Hypothesis 2 and 3 were weaker but did show significant blood pressure and heart rate drops demonstrating that the exposure was calming and physiologically restorative.

Although this study was unsuccessful in determining a measurable effect on elevated stress, it did find new data to add to past studies. Overall, the participants left the aquarium feeling relaxed, in a positive mood, and slightly aroused. It also showed that an individual does not need to spend a long time in front of the exhibit, just five minutes, to gain significant benefits.


References

Cracknell, D., White, M., Pahl, S., Nichols, W., Depledge, M. (2015). Marine biota and psychological well-being: a preliminary examination of dose-response effects in an aquarium setting. Environment and Behavior, 1-28. doi: 10.1177/0013916515597512


Social structure in a critically endangered Indo-Pacific humpback dolphin (Sousa chinensis) population

by Robbie Roemer, SRC student

It is sometimes hard to comprehend animals besides humans, have the ability to ‘socially learn’ having complex social structures within their animal community. But such is the case with a variety of species including: lemon sharks (Guttridge et al. 2012; Guttridge et al. 2009), a variety of marine mammals (Krützen et al. 2005), and most astonishingly, the common crow (Hunt and Gray 2003).  Recently published in the journal of Aquatic Conservation: Marine And Freshwater Ecosystems, a new study investigated the social structure and behavior of a critically endangered Eastern Taiwan Straight (ETS) population of Indo-Pacific humpback dolphin.

In a sense, social behaviors are an assembly of strategies that increase the probability of survivorship and reproductive potential (fitness). Examples of social structure can include successful foraging, predator defense, and learning integral survival skills. As such, the linkages between social structure and species population status can have integral conservation implications. For some time, cetaceans (order of mammals including whales and dolphins) have been noted to have a wide variety of social behaviors. Concurrently, populations of cetaceans have been over-exploited and are encountering a wide array of anthropogenic stressors.

The Indo-Pacific humpback dolphin (Sousa chinensis) is an estuarine population constricted to the west coast of Taiwan, thus making it genetically different than other populations of Indo-Pacific humpback dolphin. This population is relatively small, and almost always observed no further than 3 km from the shoreline. A population this small and isolated may have inherent benefits to having a more cohesive and less flexible social structure. This makes sense considering it would allow for easier transmission of information critical to the survival of the species (i.e. location of prey, predator avoidance, etc.). However, the down side of such a small population in close proximity to shore makes this species extremely vulnerable to anthropogenic threats including habitat loss, and habitat degradation from the process of development.

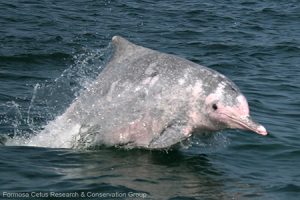
In this study, scientists conducted surveys within the near-shore waters of western Taiwan during the summers of 2007 to 2010. The scope of the project was essentially a mark-recapture study design. When an individual was spotted, the team slowly moved close, taking photographs of both sides of the dolphin. After each survey, photographs were analyzed to identify individuals to an ongoing species catalogue that has been accumulating since 2002. The Eastern Taiwan Straight population of humpback dolphin possesses a unique pattern of spotting, acting almost like a fingerprint, allowing researchers to discern individuals within the overall population. This same unique pattern of spotting is retained their entire lives, and lets researchers photographically identify an individual throughout the dolphins entire lifespan.

An Indo-Pacific humpback dolphin surfaces. Note the extensive and unique spotting pattern (Photo credit: Formosa Cetus Research and Conservation Group)

An Indo-Pacific humpback dolphin surfaces. Note the extensive and unique spotting pattern (Photo credit: Formosa Cetus Research and Conservation Group)

ETS dolphins were considered associated if they were observed in the same group and were actively participating in common behaviors like feeding or traveling. Detailed statistical analysis allowed researchers to investigate several key metrics with obtained data. Relationships between individuals were calculated using an equation called an Association Index or ‘AI’, which was evaluated within a statistical software package. Without getting too detailed, this formula gave researchers a representation of social structure in an association matrix. This matrix then permitted researchers to test for preferred and avoided associations within the population. Modularity (Q), was represented as the difference between observed and expected associations between clusters, Q-values greater than 0.3 is an accurate representation of social division. Other metrics included utilizing a network analysis statistical toolset to determine basic properties of networks (social or otherwise), and effect of calf presence on association patterns. Network analysis examined grouping strength, reach, and clustering coefficients.

With highly interconnected, ‘tight-knit’ cohesive social networks, the aforementioned parameters tend to be significantly greater than those values encountered at random. To determine if calf presence had any effect on association patterns, scientists divided sightings into two groups, depending on if a calf was also sighted. Through even more statistical analysis (randomized permutation tests) scientists could inspect whether there was a difference in mean group size between the presence and absence of calves.

Results:

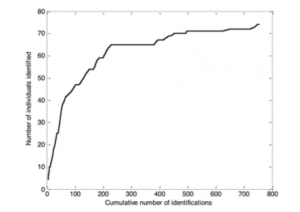
A total of 74 individual dolphins identified in 121 sightings during the sampling period with a sum of 928 total photographs. Group sizes ranged from single individuals to groups of 31 dolphins, with each of the 74 dolphins in the study sighted at least twice. Permutation tests indicated both preferred and avoided long-term social associations. Mathematical modeling showed short-term associations dissipated in less than a day, while long-term associations only started to drop off after 10 years! Cluster analysis discovered no obvious clustering (tightly knit groups within a group) and no strong social divisions within the population but alternatively, showed a strong centrally dense structure.  Group sizes were larger in the presence of a calf, with a significantly larger clustering coefficient.

Graph depicting the accumulation of new individuals spotted over the entire study period (Dungan et al. 2015).

Graph depicting the accumulation of new individuals spotted over the entire study period (Dungan et al. 2015).

So what exactly does this data tell us?

Firstly, the researchers have determined that the ETS population of humpback dolphin is a social network primarily characterized by cohesion and long-term stability. For most dolphin species, displaying these characteristics is very rare occurrence. Other research on bottlenose dolphins have suggested that long-term stability and cooperation may exist only in confined isolated regions to maximize the transmission of information such as successful foraging techniques which are vital to the survival of the species (Rendell and Whitehead, 2001).  The authors propose this could be the case for the ETS humpback population as well, considering the extremely anthropogenically depleted environment of the western coast of Taiwan, and the isolated population of ETS humpback dolphins. Lastly, it seems mother and claves in the ETS humpback population are critical to the maintenance of the entire social structure. Through the aforementioned statistical analyses, it is inferred this subpopulation of humpback dolphins may indeed utilize nursery groups where breeding females actually maintain cooperative care for the calves. This adaptation has several benefits including increasing the overall ecological fitness of the calf (thereby increasing overall offspring survivorship) as well as giving a chance to young/newly mature females to practice mothering behavior. The authors also attribute this communal behavior as a result of the subpopulation living in such degraded habitats.


References

Dungan, S. Z., Wang, J. Y., Araújo, C. C., Yang, S. C., & White, B. N. (2015). Social structure in a critically endangered Indo‐Pacific humpback dolphin (Sousa chinensis) population. Aquatic Conservation: Marine and Freshwater Ecosystems.

Guttridge, T. L., van Dijk, S., Stamhuis, E. J., Krause, J., Gruber, S. H., & Brown, C. (2013). Social learning in juvenile lemon sharks, Negaprion brevirostris. Animal cognition16(1), 55-64.

Guttridge, T. L., Gruber, S. H., Gledhill, K. S., Croft, D. P., Sims, D. W., & Krause, J. (2009). Social preferences of juvenile lemon sharks, Negaprion brevirostris. Animal Behaviour78(2), 543-548.

Holzhaider, J. C., Hunt, G. R., & Gray, R. D. (2010). Social learning in New Caledonian crows. Learning & Behavior38(3), 206-219.

Krützen, M., Mann, J., Heithaus, M. R., Connor, R. C., Bejder, L., & Sherwin, W. B. (2005). Cultural transmission of tool use in bottlenose dolphins. Proceedings of the National Academy of Sciences of the United States of America102(25), 8939-8943.

Hunt, G. R., & Gray, R. D. (2003). Diversification and cumulative evolution in New Caledonian crow tool manufacture. Proceedings of the Royal Society of London B: Biological Sciences270(1517), 867-874.

Rendell LL, Whitehead HH. 2001. Culture in whales and dolphins. Behavioral and Brain Sciences 24: 309–382.

An introduction to aquaculture

By William Evans, SRC Intern

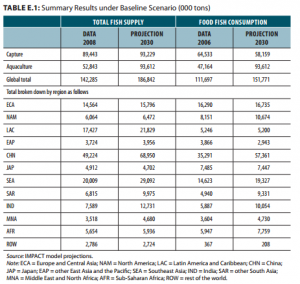
When most people think about aquaculture, commonly known as fish farming, they automatically assume that it is the culturing of the different types of fish that we commonly see in our local supermarkets like salmon and tilapia. In 2008, only 37% of the total global fish supply was provided by aquaculture and by 2030, aquaculture is projected to supply over 50% of the world’s total fish supply (Kobayashi, 2015).  Despite aquaculture’s increasing demand, there are still negative associations that coincide with the industry. Increasing consumer awareness of the product source and safety can negate many of these misconceived notions. There are resources like the Monterey Bay Aquarium Seafood Watch Program that recommends what food is safe to eat in a specific state and the sustainability of that industry.

fish2030a

This table displays data taken in 2008 and the projected data for capture fisheries versus aquaculture in 2030. (Source: Fish to 2030)

Because a majority of our fishing practices are unsustainable because of actions such as longlining and bottom trolling, we are depleting our global fisheries. Aquaculture is gradually being used to fill the void where wild caught fisheries once were. Although a large portion of aquaculture is still used for food production, there are other uses for aquatic farming. Some examples include stock enhancement, research, ornamental fish production for aquarium trade, as well as supporting the production of pharmaceutical, biotechnology, and nutritional products (What is Aquaculture, 2015) . Aquaculture’s effect on biotechnology can help improve the conservation and management of wild stocks by providing useful information about the fish species such as fish health and growth rate (Bartley, 2005). Biotechnology in aquaculture also assists in increasing the nutritional value of fish feeds, increase the growth rates and productivity of cultured species, and help protect environments by increasing the sustainability of aquaculture (Bartley, 2005).

Farmed Salmon WWF

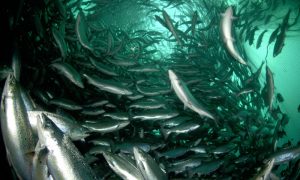
This photo from the World Wildlife Fund shows the amount of salmon that can be cultured in a smaller area. They also state that it only takes between 1.3 to 1.7 pounds of feed to produce one pound of salmon, in comparison to the 10 to 12 pounds of feed to make one pound of beef. (Source: http://www.worldwildlife.org/industries/farmed-salmon)

The feeds used in aquaculture are usually composed of fishmeal and fish oil, which is not a sustainable part of the industry. Currently there are efforts to use vegetable products or terrestrial animals, like chickens, in some aquaculture feeds. The Soy-In-Aquaculture Managed Research Program is researching to determine the chemical amount found in soybean meal that can be then used in feeds for aquaculture. At the Aquaculture Investment Workshop 2015, which was hosted at the University of Miami, the U.S. Soybean Expert Council stated that soy production in the U.S. has increased 1.5 times per year and “US farmers will continue to respond to [the] demand,” says USSEC CEO, Jim Sutter (Nadkarni, 2015). This desire for the use of soy reflects on the need to conserve aquatic ecosystems and increase the sustainability of this industry.

As stated before, aquaculture and marine conservation are combined through stock enhancement strategies and restocking. Stock enhancement is adding individuals to a healthy population and restocking is adding individuals to depleted populations. Usually these strategies consist of releasing farm -raised juveniles into the wild for populations that are overfished or threatened by habitat loss and ocean acidification (Stock Enhacement, 2015). This process is strategic as to what point in the lifecycle the species should be released into the wild, where specifically they should be released and the timing, and the dynamics of the ecosystem. Currently, NOAA is working with partners for stock enhancement for a variety of species such as black abalone, blue crab, oysters, queen conch, spotted seatrout, winter flounder, and many more. By providing support to these species that are at risk due to an array of pressures, aquaculture can help alleviate some of the pressures on the wild stocks.

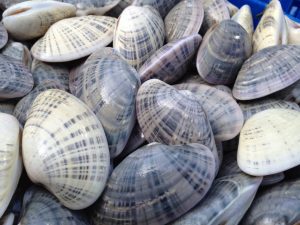
Many universities and research and development companies also focus on other topics aside from food production. For example, at the University of Miami, although some research and development is focused on biotechnology and increasing the yield of certain species, there are other studies concerned with bioenergetics, nutrition, developing proper protocols for shipping of various species, and many more. In October, Professor Bruce Barber received an $83,000 from the Aquaculture Resource Council to fund his research in the state of Florida to advance aquaculture for shellfish, tilapia, shrimp, and even alligator (Cotton, 2015). Because he believes that the Sunray Venus clam could potentially be the “next big aquaculture crop” for the state of Florida, he is focusing most of his research around this unexploited food source (Cotton 2015). Research like Barber’s can potentially change the market as to what consumers actually eat and can help protect the wild clam stocks in this region. Most of the public does not know that aquaculture can be used for restocking, stock enhancement, and even to do further research on wild aquatic species. Educating the public about topics that illustrate an intersection between aquaculture and marine conservation can change some of the negative associations with aquaculture. Consumer awareness and education through outreach and informal education about topics like aquaculture can change the mindset of the public to being more conscious of the benefits of such a controversial field.

Sunray Venus Clams

Sunray Venus Clams: The Sunray Venus clam, the focus of Barber’s research, is potentially Florida’s upcoming, large aquaculture crop (http://cutthroatclams.com/hello-world/)


Sources:

Cottton, Emma. “Professor Bruce Barber receives grant for aquaculture research.” The Current. 26 October 2015. Web. < http://theonlinecurrent.com/professor-bruce-barber-receives-grant-for-aquaculture-research/>

Fisheries and Aquaculture topics. Biotechnology. Topics Fact Sheets. Text by Devin Bartley and Rohana Subasinghe. In: FAO Fisheries and Aquaculture Department [online]. Rome. Updated 27 May 2005.

Kobayashi, Mimako, et al. “Fish to 2030: The Role and Opportunity for Aquaculture.” Aquaculture Economics & Management (2015): 282-300. Print.

Nadkarni, Avani. “Aquaculture Investment Workshop 2015 blog: Recap on all the news here.” Intrafish. 05 April 2015. Web. 15 Nov 2015. <http://www.intrafish.com/free_news/article1411080.ece>

“Aquaculture for Stock Enhancement.” Aquaculture. National Oceanic and Atmospheric Association, n.d. Web. 12 Nov 2015. < http://www.nmfs.noaa.gov/aquaculture/science/11_stock_enhancement.html>.

“What is Aquaculture.” National Oceanic and Atmospheric Association, n.d. Web. 12 Nov 2015.< http://www.nmfs.noaa.gov/aquaculture/what_is_aquaculture.html>.

Ocean acidification alters fish populations indirectly through habitat modification

By Shannon Moorhead, SRC Intern

In recent years, it has become apparent that increased CO2 emissions have farther reaching consequences than simply raising the temperature of Earth’s atmosphere.  A significant amount of CO2 is absorbed by the ocean, which raises its acidity through chemical reactions with water molecules.  This process, termed ocean acidification, has a large number of potentially detrimental effects on biodiversity, interactions between species, and individual species fitness.  Elevated CO2 levels encumber the ability of certain invertebrates, such as corals and snails, to build calcium carbonate skeletons and can drive habitat shifts that degrade ecosystems.  Laboratory experiments have also shown that prolonged exposure to CO2 negatively affects the ability of fish to perform predator-avoidance behaviors.

Nagelkerken et al 2015 explores the effects of ocean acidification with in situ study, meaning the experiment was done in the natural habitat of the subject species.  A field study allowed for the researchers to account for the indirect effects of changes in habitat on fish behavior and abundance, necessary to more accurately predict species responses to ocean acidification, as well as their potential consequences for ecosystems.  The authors observed habitat coverage, fish habitat association, fish escape response performance, and fish and predator population density at 2 separate locations: White Island, New Zealand and Vulcano Island, Italy.  Both sites are characterized by vents that naturally produce CO2, maintaining the acidity of the surrounding water at a much higher than average level, levels that the rest of the oceans may reach by the end of the century.

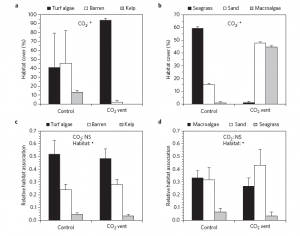
a,b, Habitat cover at White Island (a) and Vulcano Island (b). c,d, Fish density in each habitat at White Island (c) and Vulcano Island (d)

a,b, Habitat cover at White Island (a) and Vulcano Island (b). c,d, Fish density in each habitat at White Island (c) and Vulcano Island (d)

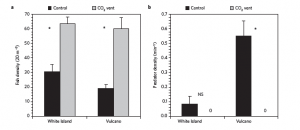
At both locations, habitat coverage changed significantly between the control sites (far enough away from the vents to not be affected by the elevated CO2) and the sites near the vents.  Increased acidity caused ecosystem phase shifts; complex ecosystems mottled with vegetation, algae, patches of rock or sand give way to simpler communities dominated by either algae or sand near the vents.  The fish species observed, the common triplefin and Bucchich’s goby, both associated primarily with algae and sand or rock bottom areas.  Increased biomass of preferred habitat, along with higher levels of prey abundance in these habitats, most likely contribute to the significant difference in fish density observed between the vent and control sites.  Fish density near the vents was greater than double density measured at control sites.  This may have also been a result in part of the lack of predatory fish observed near the CO2 vents.

a, fish escape speed at White Island (top panel) and Vulcano Island (bottom panel). b, jump distance (distance fish moved while escaping) at White Island (top panel) and Vulcano Island (bottom panel). c, startle distance at White Island (top panel) and Vulcano Island (bottom panel)

a, fish escape speed at White Island (top panel) and Vulcano Island (bottom panel). b, jump distance (distance fish moved while escaping) at White Island (top panel) and Vulcano Island (bottom panel). c, startle distance at White Island (top panel) and Vulcano Island (bottom panel)

Though effects of elevated CO2 actually improved fish abundance, it still had negative effects on the behavior of the fish species.  Fish at vent sites escaped threats more slowly than fish at control sites and usually waited until the threat was closer to begin moving away, indicating CO2 exposure lessened the ability of the fish to avoid predation.  One exception to this, in the algae dominated habitats at the Vulcano Island site, there was little difference between the startle distance (distance from the threat to the fish when the fish starts its escape) of fish living at the control sites and fish living near the vents.  Fish may begin their escape response later in this habitat because they feel more relaxed knowing they have easy access to shelter.

a, fish density at White Island and Vulcano Island. b, predator density at White Island and Vulcano Island

a, fish density at White Island and Vulcano Island. b, predator density at White Island and Vulcano Island

This study is the first example of the negative direct effects of ocean acidification on fish behavior being counteracted by indirect effects that actually increase fish abundance and survival.  Contrasting laboratory-based predictions that less productive and simpler ecosystems would harm fish populations, this paper demonstrates the need for more in situ studies on the effects of elevated CO2 levels.  Indirect effects, such as changes in predator and prey abundance and habitat phase-shifts, must be considered when attempting to accurately predict the consequences of climate change.

Nagelkerken I, Russel BD, Gillanders BM, Connell SD (2016) Ocean acidification alters fish populations through habitat modification. Nature Climate Change 6: 89-93


The Best Approach to an Economic Marine Instability: Guam’s Coral Reefs

By Casey Dresbach, SRC Intern

Integrated models can simulate the ecological, social, and economic consequences of different marine management approaches. In this study, a dynamic reef biophysical model is linked with human behavior models for the coral reef ecosystem of Guam (jcpag2012, 2012).  Researchers, Mariska Weijerman, Cynthia Grace-McCaskey, Shanna L. Grafeld, Dawn M. Kotowicz Kirsten L.L. Oleson, Ingrid E. van Putten completed a study that addressed this problem in detail.

Caption: Healthy Coral Reef is pictured in Guam

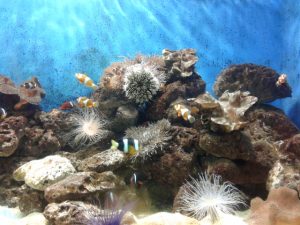
Healthy Coral Reef is pictured in Guam

For Guam, fishing and diving are two important reef-based activities directly reliant on Guam’s coral reef ecosystems. Guam residents as well as tourists participate in between 256,000 and 340,000 dives on Guam’s reefs every year. Tourism is one of the country’s largest economic sectors, due in part to Guam’s status as a world-class scuba diving destination. Much of the fishing pressure exerted on Gaum’s coral reefs comes in the form of artisanal or subsistence fishing. Consequently, most of the catch goes unreported as it is destined for personal consumption rather than the open market.

Since there is an advanced tourism industry in Gum there are corresponding challenges to environmental sustainability. The problems that evolve as a result of such activities result in a heavy decline or loss of important fish species as well as the degradation or acidification of reefs from an inadequate treatment of sewage systems. Guam’s reefs have also been troubled by poorly executed coastal development and high sediment load from land burning in watersheds, an area or region drained by a river, river system, or other body of water.

This combination of factors caused policy makers to seek alternative approaches. In this case study, Mariska Weijerman, Cynthia Grace-McCaskey, Shanna L. Grafeld, Dawn M. Kotowicz Kirsten L.L. Oleson, Ingrid E. van Putten sought to create an integrated model to analyze a hypothetical way of a better management system. Three agencies in Guam worked to implement fishing limitations and reduce land-based sources of pollution in order to improve the quality of its watersheds. The study was done to model the current situation in Guam by combining all factors (e.g. social, economic, biologic) and analyzing the relationships among them. The social factor is the tourist attraction to dive, the economic is the combination of fishing and diving prices to add to Guam’s GDP, and the biological is the physical degradation of the natural reef as a whole. The results can be looked at in two components: a description of the dive tourism and reef fishing behavior models, and a description of the changes in the hypothetical implemented policies. The authors show that consequences across management strategies are variable. For example, policies intended to improve overall species abundance on coral reefs lead to undesirable outcomes for artisanal fishers who have traditionally relied on fishing the reefs in order to feed their families.  A policy that prioritized economic growth in favor of preserving Guam’s social fabric and natural resources may prove disastrous to the environment and degrade the quality of its chief resources in achieving such growth

The model created by M. Weijerman et. Al included four parts: a quantitative ecological, a qualitative fishery, a qualitative tourism human behavior component, as well as an accumulated component, which simulated socio-economics – the combination of all models. The “Guam Atlantis Model,” was a virtual coral reef system built to envision a better-preserved reef scenario. The ecological model allowed researchers to evaluate ocean acidification, ocean warming, and ocean accretion and erosion. This created a feasible relationship between the reef’s ecosystem and its function to provide shelter, while accounting for the current poor reef management of Guam. The fishery model shown in Figure 4, (Mariska Weijerman a, 2015) analyzed mortality rates and species numbers while the human behavior model focused more on how current, traditional management of Guam’s waters were degrading rather than improving the coral reefs.

The Fishery Model representingan influence of species abundance, economic and socio-demographic variables and participation of reef fishing on Guam.

The Fishery Model representingan influence of species abundance, economic and socio-demographic variables and participation of reef fishing on Guam.

Results show that there is little point in trying to manage the reef ecosystem and those who use it without also managing the watershed. This means that rather than concern people with the nuances of preserving natural resources, they should instead focus on educating stakeholders on overarching or key factors to accomplish good policy. It is important to understand those dynamic factors initially before consolidating and agreeing on a final solution. In terms of moving forward, Guam’s policy makers should consider management approaches with the notion of understanding a foundation of where these problems begin. The pollution of the watersheds can only be completely restored with an understanding of where the pollutant factors come from (divers, boating, bycatch as a result of overfishing – underreported catch is a big part of the problem. Implementing policies on the sectors of the problem will initially cause some negative impacts on Guam’s economic status, but will improve it in the long run.

References

jcpag2012. (2012, June 24). Clownfishes and Coral Reefs in Guam. Wiki Commons.

Mariska Weijerman a, b. C.-M. (2015, July 10). Towards an ecosystem-based approach of Guam’s coral reefs: The human dimension . Elsevier .


Community-based hunting management of large carnivores and herbivores: is a mutually beneficial relationship possible?

By Rachel Skubel, SRC Intern

When conserving species, considering the human dimension is generally essential to a successful trajectory. More and more, as our cities expand on land, and access to the ocean increases, there is inextricable overlap. In some cases, conservation efforts are inherently linked with having these animals around – for example trophy hunting of large carnivores (such as lions in South Africa – although many are captive bred) and herbivores (like the Markhor in Pakistan).  This is an important linkage – the large animals of these efforts are often keystone species in the ecosystems they interact with, and can also play an important economic role for human societies they interact with.

 What if these large animals disappeared?

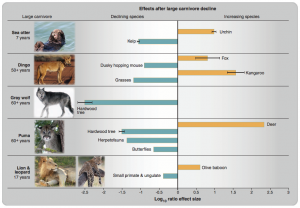
Rather unfortunately, there has been ample opportunity to assess the impacts of large carnivore and herbivore declines on other life. William Ripple has informative publications on both scenarios (herbivores and carnivores). Here are a few examples from Ripple et al. 2015, showing how the loss of one ‘regulating’ species can have cascading impacts on the extent of other species;

Observed impacts following large carnivore decline (Image: Ripple et al. 2015)

Observed impacts following large carnivore decline (Image: Ripple et al. 2015)

Humans <-> Wildlife*

The questions I’m asking today are – outside of fully protected ‘reserves’, which aren’t always feasible, what are some effective conservation strategies? What are some successful programs, and what should be considered going into the future? And, what can be translated from the terrestrial to marine realm?

Large carnivore and herbivore species are at risk from human activity (Images: National Geographic [http://animals.nationalgeographic.com/animals/wallpaper/lion-stalking-botswana.html], and The Tribune [http://tribune.com.pk/story/968489/big-game-trophy-hunting-helps-revive-markhor-numbers/]

Large carnivore and herbivore species are at risk from human activity (Images: National Geographic [http://animals.nationalgeographic.com/animals/wallpaper/lion-stalking-botswana.html], and The Tribune [http://tribune.com.pk/story/968489/big-game-trophy-hunting-helps-revive-markhor-numbers/]

 *More and more we are learning that environmental forces need to be considered as well, such as rainfall patterns influencing spatial patterns of vegetation, which in turn draw herbivores and their predators (Gordon et al. 2004, Boone et al. 2012).

 (1) What is the trend of wildlife-human overlap?

In terms of large herbivores, often large protected areas are needed to cover the entire range, for example to account for migrations of wildebeest across the African continent (Boone et al. 2012). Protecting animals from poaching across this massive, dynamic range is a challenge, so this issue persists (Ripple et al. 2015). A study by Rosie Woodroofe (2000) surmises that

“regional and temporal variation in individual species’ sensitivity to human density is more likely to reflect the activities of local people than the phenotypes of local carnivores.”

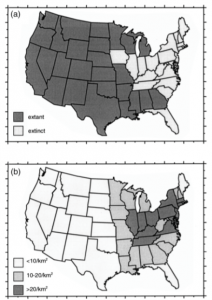
Figure 3: Wolf presence in the United States, in 1900 and 1944 (Image: Woodroofe et al. 2000)

Figure 3: Wolf presence in the United States, in 1900 and 1944 (Image: Woodroofe et al. 2000)

This is neatly visualized by changes in wolf presence in the US from 1900 to 1944 alone (figure 3). Her work analyzes carnivore populations in North and South America, and Africa, to find ‘critical human densities’ (in people/km2) which had already resulted in local extinctions, or may do so in the future based on current trends. These relationships were used to paint a picture of carnivore populations as human density increases.

Woodroofe illustrates that as human density continues to expand, more chances for wildlife conflict will arise. So, how does this conflict relate to social and economic facts?

 (2) How do humans perceive the animals?

Some interesting work has been done in Norway on people’s attitudes towards large carnivores. Kleiven et al. (2002) surveyed a representative sample of 3134 individuals, and found that:

  • Wolves and bears less acceptable than lynxes and wolverines, when seen close to where the respondents lived
  • Acceptability declined with increasing: Lack of personal control, economic loss, and age
  • Acceptance was higher among urban residents, and males

The authors’ resulting recommendation was to integrate social and situational (e.g. geographically) predictors of attitudes into wildlife management strategies.

Continuing in this vein, Roskaft et al. 2003 (also Norway) found that people with higher education and an interest in outdoor activities (hiking, hunting) had greater acceptability than those with ‘lower’ education (a measure which ranged from ≤9 to > 12 years of schooling), and no interest in outdoor activities. Accordingly, the authors suggest an educational program about large carnivore ecology (biology and habits), and giving people first-hand experience with the animals.

In a summary of carnivore management over time, Treves and Karanth (2003) describe a transition from fear and economic interests as driving forces, to science-based, ecosystem-based management approaches, which can place less stress on lethal control. The authors recognize the political and social complexities behind effective management, and again stress the importance of engaging the public to enhance conservation success.

To summarize so far, these large animals are increasingly sharing space with humans, and humans are not always accepting of their presence. Aside from habitat destruction, poaching has led to declines in their numbers worldwide, which is unfortunate for both people (i.e. ecosystem services), the species in question, and sometimes for other organisms they indirectly/ indirectly interact with.

(3) Some recent examples of integrating wildlife into human economies

Although these two examples are of different scale, the theme of community-based incentivization of conservation through hunting management is present in both. 

One morning on a drive to our field site, my M.Sc. supervisor shared the story of the much-maligned Makhor in Pakistan, which introduced to me the concept of hunting as a conservation strategy. Long subject to poaching, enforcement was difficult over such the Makhor’s large range. In 1994, 1996, and 2008, IUCN red list assessment rated the Makhor as Endangered. However, this animal has transitioned to a sunnier ‘Near Threatened’ status as of 2015, with most subpopulations seeing an increasing trend, and an estimated 5.808 mature individuals in the cumulative population. Although there have been a suite of conservation measures across India, Afghanistan, and Pakistan, the latter has implemented community-based trophy hunting programs in addition to federal protections. Here, the government distributes only 12 hunting permits per year, to these programs. Notably, 80% of the permit fees (when purchased by the eventual hunter) go to the community, and the other 20% to provincial authorities leading conservation efforts [http://www.iucnredlist.org/details/3787/0]. As a result, the community in question is motivated to ensure the health of this species – not only does the permit bring in income year after year, the hunting party might further spend money in the community while in the area (i.e. using local guides). From 1998 to 2008, $830,000 (USD) was allocated to participating communities, and the relative rarity of the permits is increasing their value. However, with only 12 permits available and unmanaged area remaining in the Country, increasing the annual allotment could be the next step.

Trophy hunting in Africa is a multi-faceted topic I can’t possibly cover in its vastness, but is useful to mention as a large-scale contrast to the previous case. An interesting paper from Naidoo et al. (2015) tells us that in Namibia, repurposing agricultural land for both tourism and hunting has provided a relatively consistent income source for the local community, and might provide a strong motivation for conservation. As with our last example, the health of the species can directly influence the health of the local economy, so maintaining the former is of great interest to the community. An overview from Lindsey et al. (2006) tells us a sum of 1,394,000 km2 in sub-Saharan Africa is dedicated to the controversial practice of trophy hunting, incidentally larger than the area of its’ national parks (at the time of the paper). Namibia is among the countries in this region with an increasing number if visiting hunters (1988 – 2006, Lindsey et al. 2006), and has seen an increase in gross annual hunting revenue over the same period. This macro-view is only one side of the story, as socio-economic stability within the related communities, just like conservation success, is dependent on so many factors and measures. As one country in this region prohibits hunting, another may then see an influx of hunters. In areas reliant on income from trophy hunting, there can be a self-sustaining source of money to employ anti-poaching officers, helping to regulate activities detrimental to the target animals and the surrounding community. Photo-tourism is another possible source of income for these hunting areas, and is certainly valuable to consider for countries designing management and conservation plans – are some areas/species better suited to conservation income this source?

With both of these cases, wildlife and humans are linked in their habitats, and in some ways are helping the other persist – and in the case of the Pakistan Markhor, perhaps move away from a trajectory towards local extinction.

Where is the crossover with marine conservation?

Despite the differences in environment and range, as well as stakeholders, there is some common ground with managing large marine species. For example:

  • Large sharks, such as white sharks, have faced issues with public perception that challenge their conservation (e.g. Shark culling in Australia – McCaugh et al. 2015). Could social acceptance studies of terrestrial carnivores be used to further understanding of attitudes towards marine predators?
  • Design of regulations for mixed-use marine protected areas can draw on lessons from terrestrial areas – what policies that successfully influenced human behavior such that habitat was minimally impacted, which can be translated to a marine environment?

The similarities, as well as the differences, between marine and terrestrial management, (and animal movement) are many. As countries strive to reach their goals of protection in both realms, the crossover between humans and wildlife brings up an important interaction to consider in planning management, and in some cases an opportunity to work towards a mutually beneficial relationship.


References

Boone, R. B., Thirgood, S. J., & Hopcraft, J. G. C. (2006). Serengeti wildebeest migratory patterns modeled from rainfall and new vegetation growth. Ecology, 87(8), 1987-1994.

Gordon, I. J., Hester, A. J., & Festa‐Bianchet, M. (2004). Review: the management of wild large herbivores to meet economic, conservation and environmental objectives. Journal of Applied Ecology, 41(6), 1021-1031.

Kleiven, J., Bjerke, T., & Kaltenborn, B. P. (2004). Factors influencing the social acceptability of large carnivore behaviours. Biodiversity & Conservation, 13(9), 1647-1658.

Lindsey, P. A., Roulet, P. A., & Romanach, S. S. (2007). Economic and conservation significance of the trophy hunting industry in sub-Saharan Africa.Biological conservation134(4), 455-469.

McCagh, C., Sneddon, J., & Blache, D. (2015). Killing sharks: The media’s role in public and political response to fatal human–shark interactions. Marine Policy, 62, 271-278.

Naidoo, R., Weaver, C. L., Diggle, R. W., Matongo, G., Stuart‐Hill, G., & Thouless, C. (2015). Complementary benefits of tourism and hunting to communal conservancies in Namibia. Conservation Biology.

Røskaft, E., Bjerke, T., Kaltenborn, B., Linnell, J. D., & Andersen, R. (2003). Patterns of self-reported fear towards large carnivores among the Norwegian public. Evolution and human behavior, 24(3), 184-198.

Ripple, W. J., Estes, J. A., Beschta, R. L., Wilmers, C. C., Ritchie, E. G., Hebblewhite, M., … & Wirsing, A. J. (2014). Status and ecological effects of the world’s largest carnivores. Science, 343(6167), 1241484.

Ripple, W. J., Newsome, T. M., Wolf, C., Dirzo, R., Everatt, K. T., Galetti, M., … & Van Valkenburgh, B. (2015). Collapse of the world’s largest herbivores. Science Advances, 1(4), e1400103.

Treves, A., & Karanth, K. U. (2003). Human‐carnivore conflict and perspectives on carnivore management worldwide. Conservation Biology, 17(6), 1491-1499.

Woodroffe, R. (2000). Predators and people: using human densities to interpret declines of large carnivores. Animal conservation, 3(02), 165-173.

Krill’s Rapid Decline; Small Scale Manifests a Larger Scaled Result

By Casey Dresbach, SRC Intern

Krill (Euphausia superba) are small crustaceans found in all of the world’s oceans. They rely on small phytoplankton, single-celled plants as their food source that drift near the ocean’s surface. The tiny primary consumers rest at the bottom of the ecological marine food pyramid yet are key to the diets hundreds of different animals ranging from terrestrial to aquatic organisms. Because these organisms are situated at the lowest trophic level, they are forced to support all life in the above levels. If they were to be extinct in a day, there would be an off balance in the interconnected food web and populations between the ocean and parts of terrestrial regions would spiral down their declines.

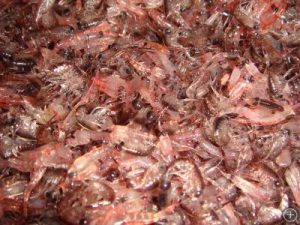
A zoomed in image of an abundance of Krill. In terms of biomass, they are the most successful in terms of proliferation in the world’s ocean.

A zoomed in image of an abundance of Krill. In terms of biomass, they are the most successful in terms of proliferation in the world’s ocean.

A few of the organisms that feed on Krill include sea birds, fish, baleen whales, and penguins. Their relative small size has little do with the large impact they have on the organisms several times their relative dimension. In terms of their numbers, one might question how such small organisms can support a large baleen whale. Krill gather into dense swarms that can have from 1,000 to 100,000 individuals per cubic yard (1 cubic meter), and a swarm can extend from 30 feet (10 meters) to almost 4 miles (6 km) in length. With this strategy they are able to concentrate areas of distribution and make reproduction fairly easy and attainable with such proximity.

The seven characteristics of life include the several aspects an organism must attain to survive as an individual. The most relative to Krill specifically is, “living things adapt to their environments. The most “primitive krill” had to adapt to a specific habitat and only then the survival of the fittest could come into play and those who were best suited would grow and reproduce and hence manifest a greater population. Their strongest adaptation supports their best suiting habitat, sea ice. Their relationship with sea ice is beneficial; it acts as both shelter and a feeding ground for larval and juvenile krill in the winter and in Antarctic regions year round. Temperature is favorable to the key stone species as well as green and blue algae. Krill have evolutionarily become accustomed to this habitat and have thus amplified in such regions.

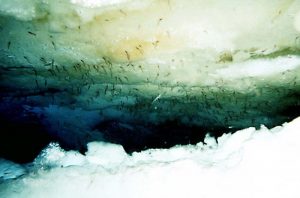
Krill habituate on sea ice primarily for favored temperature, but also as an easy locus for their algal food source.

Krill habituate on sea ice primarily for favored temperature, but also as an easy locus for their algal food source.

There are two critical aspects leading to a sharp decline in the keystone species. Sea ice loss is of significant concern to krill and the several species it feeds. Climate change is to blame for the gradual melting of the habitats. An increase in temperature – having much to do with global warming – is shrinking the sea ice in both the summer and winter. Krill struggle to adapt to such a difference in temperature and cannot survive. Their failure to survival has led to a decrease in their numbers by about 80% since the 1970s, according to several experts. The second agent to point a finger at is the excessive amount of krill fishing in Antarctic waters. Krill are targeted for their supplementary advantages they can offer pet food and food fertilizer. But most recently, have been found to be a great source of omega-3 fatty acid supplements that ultimately make their way into the pharmaceutical vitamin world or the cosmetic industry.

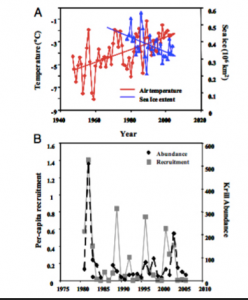
In an effort to better investigate the long-term changes in the physical environment and how they pose a threat to the ecological marine food web, Wayne Z. Trivelpiece, Jefferson T. Hinke, Aileen K. Miller, Christian S. Reiss, Susan G. Trivelpiece, and George M. Watters conducted a study in Antarctica. Sea ice in the West Antarctic Peninsula (WAP) and Scotia Sea are hypothesized to affect penguin populations directly. The specific species included the Adélie penguin (Pygoscelis adeliae) and the Chinstrap penguin (Pygoscelis antarctica). The Adélie favor ice packed habitats in the winter whereas the Chinstrap favor ice-free water to thrive. They performed a series of analytical studies to ultimately come to the conclusion that it is not solely the melting of the sea ice causing the decline in numbers, it’s the interplay of the melting and the limited availability of krill in the ocean to nutrient the penguins. These researchers compared large-scale changes in krill populations and physical conditions in both the Scotia Sea and the WAP. The relative abundance and recruitment showed a direct correlation among suitable environments including temperature as a key factor. Since krill were responding poorly to the temperature, they were dying out, and were absent for the penguins to eat.

Researchers Wayne Z. Trivelpiece, Jefferson T. Hinke, Aileen K. Miller, Christian S. Reiss, Susan G. Trivelpiece, and George M. Watters compared relative krill abundance in both the Scotia Sea and WAP in regards to several variables including: temperature, per-capita recruitment, and sea ice extent.

Researchers Wayne Z. Trivelpiece, Jefferson T. Hinke, Aileen K. Miller, Christian S. Reiss, Susan G. Trivelpiece, and George M. Watters compared relative krill abundance in both the Scotia Sea and WAP in regards to several variables including: temperature, per-capita recruitment, and sea ice extent.

If global warming continues to dominate, sea ice will continue to melt and krill will continue to lose their habitat. Without sufficient krill, penguins among many the krill’s many other predators will decline (Wayne Z. Trivelpiece, 2010)e too. Understanding how krill demography is affected by changes in the physical environment poses an outlook to predicting future changes in marine ecosystems. A single or double occurrence that happens at a small scale can have a pleiotropic affect on something grander, i.e. the marine food web.


Bibliography

(n.d.). Retrieved November 11, 2015, from Ice Stories Exploratorium:

http://icestories.exploratorium.edu/dispatches/big-ideas/krill/

Jonathan B Shurin, D. S. (2006, January 7). All wet or dried up? Real differences between aquatic and terrestial food webs. Retrieved November 11, 2015, from The Royal Society Publishing: http://rspb.royalsocietypublishing.org/content/273/1582/1

Wayne Z. Trivelpiece, J. T. (2010, November 10). Variability in krill biomass links harvesting and climate warming to penguin population changes in Antarctica . PNAS .