Assessing the effectiveness of specially protected areas for conservation of Antarctica’s botanical diversity

By Shannon Moorhead, SRC Intern

When one thinks of Antarctica, the first things that come to mind are frigid, icy weather and penguins.  Therefore, it may come as a surprise to many that Antarctica is home to a variety of plant communities.  Only 0.34 % of the Antarctic continent, and approximately 3% of the Antarctic Peninsula and offshore islands, is free of the snow and ice covering that transforms the remainder of the continent into a frozen wasteland.  Only a small fraction of the ice-free land is able to support plant life: most of it is high latitude desert, rock faces protruding out of the ice sheets, and high altitude mountain ranges.  This confines most visible terrestrial life to the coasts, predominantly along the Eastern coastline, the Antarctic Peninsula, and the Scotia Arc archipelagos.
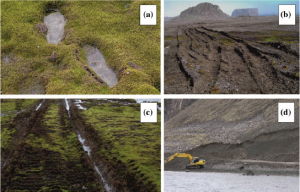
Antarctic vegetation and the damage caused to it by human activity. A) Moss and footprints b) Tire tracks through vegetation c) Vehicle tracks in moss d) Quarrying (Hughes et al., 2015)

Antarctic vegetation and the damage caused to it by human activity. A) Moss and footprints b) Tire tracks through vegetation c) Vehicle tracks in moss d) Quarrying (Hughes et al., 2015)

Even the most diverse parts of Antarctica have relatively little botanical biodiversity compared to other ecosystems.  The majority of Antarctic primary producers are cryptogams, seedless autotrophs that generally grow low to the ground, such as mosses, lichens, and liverworts.  There are only two vascular plant species native to the continent.  In addition to true plants, Antarctica is home to substantial microflora communities consisting of fungi, algae, and cyanobacteria.  Vascular plants and bryophytes (nonvascular plants like mosses and liverworts) inhabit primarily coastal areas while inland and areas with high elevation are dominated by microfloral communities and lichens.  These colonizable sites devoid of ice are few and far between, often separated by stretches of ocean or ice that can be hundreds of kilometers long.  Isolation to this extent hinders the ability of plant species to colonize new land, restricting them to specific areas.  This separation has prevented gene flow between distinct Antarctic plant communities, evolutionarily isolating them; in other words, these communities will continue to grow and adapt on their own, with the potential to eventually develop into distinct species.  The regional disparities in terrestrial biodiversity make it very easy to divide the continent into specific biogeographic regions; 15 Antarctic Conservation Biogeographic Regions (ACBRs) have been identified to provide a formal structure upon which to develop a conservation plan for Antarctica and the organisms that inhabit it.

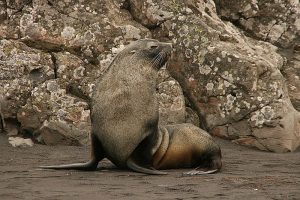
Antarctic fur seals pose a trampling threat to the continent’s vegetation (Mulichen, 2008).

Antarctic fur seals pose a trampling threat to the continent’s vegetation (Mulichen, 2008).

As human activity on Antarctica increases, it is becoming more apparent that an effective conservation strategy for the continent is necessary.  Construction, overland transport, and continuing operation all threaten terrestrial organisms, especially those inhabiting coastlines, where most tourist and research practices are focused.  Humans may also introduce invasive species, which could have detrimental effects on indigenous botanical biota.  Plant communities are also facing destruction at the hands of fur seals, whose expanding range has increased the amount of vegetation they trample and damage in the Antarctic Peninsula.  In addition to the threats affecting Antarctic plants in the immediate future, climate change has the potential to directly impact the continent’s flora.
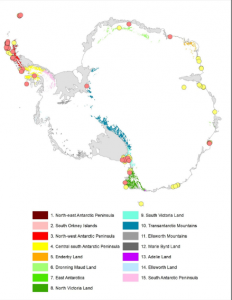
Map of ASPAs. Red circles denote vegetation specific ASPAs, yellow are ASPAs not included in this study (Hughes et al., 2015).

Map of ASPAs. Red circles denote vegetation specific ASPAs, yellow are ASPAs not included in this study (Hughes et al., 2015).

Due to the scarcity and low diversity of Antarctic vegetation, these threats could cause severe damage, possibly wiping out entire communities or species in extreme scenarios.  Recognizing the need for protection, the Protocol on Environmental Protection to the Antarctic Treaty instrumented Antarctic Specially Protected Areas (ASPAs) to maintain the diversity and health of representative Antarctic ecosystems.  However, the effectiveness of this system is questionable; only 1.5 % of Antarctica’s ice-free terrain is under the jurisdiction of ASPAs and there are multiple regions with no ASPAs at all.  33 of the 72 established ASPAs specifically note protecting plant diversity as a management goal.  Yet, these ASPAs include less than 0.5% of Antarctica’s ice-free ground and less than 16.1 km2 of vegetation cover.  This is most likely only a small fraction of the continent’s botanical life, given a 2011 study that estimated 44.6 km2 of the northern Antarctic Peninsula alone has greater than 50% probability of vegetation presence.  Another marked problem is that 96% of protected ice-free ground is within 2 ACBRs.  This offers great protection for those habitats, but does not do an effective job of preserving diversity by concentration on only one or two ecosystems.  It is blatantly apparent that Antarctica’s management strategies must be reworked in order to properly conserve both the health and diversity of its ecosystems.


Hughes KA, Ireland LC, Convey P, Fleming AH (2015) Assessing the effectiveness of specially protected areas for conservation of Antarctica’s botanical diversity. Conservation Biology 00: 1-8

 

Reconciling Development and Conservation under Coastal Squeeze from Rising Sea Level

By Timothy Hogan, SRC Intern

In the face of global warming, melting ice caps and thermal expansion gradually increase sea level, affecting the majority of the world’s coast. As a result, coastal ecosystems, such as mangrove forests and salt marshes, will lose a large amount of their diversity. The loss of settlements to flooding may also trigger massive migrations to inland cities (Nichols et al 2011), which can have many detrimental effects in and of itself. Preventative measures taken by coastal management should therefore prioritize both urban development and the shoreline’s ecosystem. Multiple views should be taken into consideration when determining adaptation strategies, since it involves a complex balance of socioeconomic pressures. However, for the sake of simplicity, most models focus on a specific set of aspect rather than the whole picture. As a consequence, these models tend to produce both conflicting and inconclusive results. This uncertainty, coupled with the innate short-sightedness of the human race, makes it becomes difficult for policymakers to create effective and scientifically supported regulations (Nicholls et al 2010).

Despite this lack of direction, environmentalists have developed many effective ways to counter sea level rise Two of these popular coastal management practices include coastal armoring and managed realignment. Coastal armoring involves the development of levees, which are effective walls of sediment, to stop water levels from spreading along the coast. While it is simple to implement and can be more cost-effective, it tends to cause “coastal squeeze”, which prevents the natural migration of marshes and mangroves (Pontee 2013). Should water level rise above the levee, the water tends to overflow and form more destructive floods, causing as much damage as what would have naturally occurred (ASFPM 2007). Managed realignment involves the manual movement of the shoreline, and is much less detrimental to nearby ecosystems (French 2006). However, this work tends to be a more expensive investment, and the withstandability and long-term impacts of the new shoreline remain unknown. Choosing between these methods effectively comes down to expenses, cost, long-term effects, and the nearby ecosystem. However, modern technology shows that the best solution may not be as simple as choosing one of these practices.

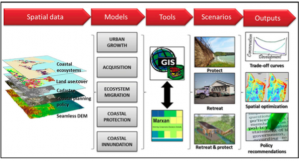
A recent study analyzed the effects of sea level rise on a coastal region in Queensland, Australia, due to its close proximity to a fast-growing city and coastal embayments. Data sets were compiled and analyzed to spatially quantify urban growth, land usage, ecosystem motion, coastal protection, and flooding. All information was combined using Marxan, a geographic information system that could spatially display and compare the gathered data. The developed map was divided into zones of equal area. Based on predicted sea level rise, urban growth, and environmental changes, the price of utilizing either coastal armoring, managed realignment, or both was calculated for each zone. An overall “trade-off” curve was produced by testing each possible scenario, and can be used to find the most optimal solution financially and conservationally.

Figure 1: A flowchart displaying the overall process behind the experimentation. Five sets of data (urban growth, land usage (acquisition), ecosystem migrations, coastal protections, and flooding (coastal inundation) were transformed into models, and combined using geographic information softwares. Testing scenarios allowed them to discern the most financially and environmentally viable solutions (Mills et al 2015).

Figure 1: A flowchart displaying the overall process behind the experimentation. Five sets of data (urban growth, land usage (acquisition), ecosystem migrations, coastal protections, and flooding (coastal inundation) were transformed into models, and combined using geographic information softwares. Testing scenarios allowed them to discern the most financially and environmentally viable solutions (Mills et al 2015).

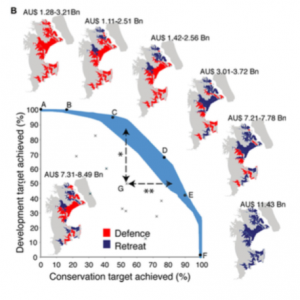
According to the data analysis, 70% of both urban and conservation goals provides optimal benefits for both parties, while also saving billions of dollars. Any less provides fewer benefits and risks, whereas more tends to be detrimental and expensive. While this may seem counterintuitive, it makes sense given the effects of retreats. When established, the changed land and new funding will decreases the number of necessary ecosystem services, including fishing, carbon storage, and water purification. Hopefully, these insights may show institutions and committees the hidden savings behind ecological preservation, as well as protecting cities.

Figure 2: Visual representation of the land distribution and trade-off curve. Blue zones represent managed rearrangement, or “retreat”, and red zones represent coastal armoring, or “defence”. The blue curve on the graph shows likely scenarios based on global sea level rise estimations. The distribution of those was set along a trade-off curve, which showed the approximate price for utilizing each method. The price range for each displayed scenario is also shown for reference (Mills et al 2015).

Figure 2: Visual representation of the land distribution and trade-off curve. Blue zones represent managed rearrangement, or “retreat”, and red zones represent coastal armoring, or “defence”. The blue curve on the graph shows likely scenarios based on global sea level rise estimations. The distribution of those was set along a trade-off curve, which showed the approximate price for utilizing each method. The price range for each displayed scenario is also shown for reference (Mills et al 2015).

While this study provided a new effective way to analyze benefits of coastal management practices, it still required the same simplicity. Vegetation, erosion, and the change of infrastructure over time were not sufficiently considered into the study, which causes predicted values to be lower than in reality. Corrections can be made with the assistance of experts in these fields. However, this new model manages to provides a new important element to non-scientists: direction. The trade-off curve is able to quantify various benefits of conservation and urbanization to find financially favorable solutions. This can act as guidance to policymakers, and may encourage them to focus on the long-term benefits of coastal lands and developments. While this may not necessarily solve the looming issues of sea level rise or address all of its repercussions, it gives vulnerable coastal civilization and environments a way to withstand the relentless rising sea.


References

Nicholls, R. J., and Cazenave, A. (2010). Sea-Level Rise and its Impact on Coastal Zones. Science, 328, 1517-1520.

Pontee, N. (2013). Defining Coastal Squeeze: A Discussion. Ocean & Coastal Management, 84, 204-207

Nicholls, R. J., Marinova, N., Lowe, J. A., Brown, S., Vellinga, P., de Gusmão, D., Hinkel, J., and Tol, R. S. J. (2011). Sea-level rise and its possible impacts given a ‘beyond 4°C world’ in the twenty-first century. Phil. Trans. R. Soc. A, 369, 161-181.

Mills, M., Leon, J.X., Saunders, M.I., Bell, J., Liu, Y., O’Mara, J., Lovelock, C.E., Mumby, P.J., Phinn, S., Possingham, H.P. and Tulloch, V.J. (2015). Reconciling Development and Conservation under Coastal Squeeze from Rising Sea Level. Conservation Letters.

ASPFM. (2007). Levees: the double-edged sword [online]. Association of State Floodplain Managers.

French, P.W. (2006). Managed realignment – The developing story of a comparatively new approach to soft engineering. Estuarine, Coastal, and Shelf Science, 67(3), 409-423.

Findings from the Convention of Biological Diversity have revealed some of the most biologically significant areas of the ocean – Paper by Nicholas J. Bax et al.

By Jeff Palumbo, SRC Intern

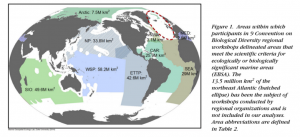
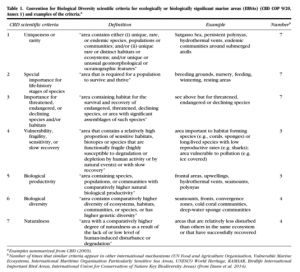
Ecologically or biologically significant marine areas (EBSAs) are the result of a global effort headed by the United Nations and the Convention on Biological Diversity (CBD) (Bax et al. 2015).  The lack of marine protected areas beyond national jurisdictions was noted by the UN and addressed by the CBD. Experts from 92 countries and 79 international bodies assessed two thirds of the world’s ocean, consisting of marine areas from multiple jurisdictions.  Approximately 250 million squared kilometers of the ocean’s area was evaluated and ranked based on “the naturalness criterion”. A ranked system based on biological and ecological factors, agreed upon by Parties to the CBD. Researchers found that high-ranking EBSAs were around 31%, proving the scarcity of undisturbed oceanic habitats left.  In total, only 204 areas of the study site proved to abide by EBSA criteria. These actions have since lead to increased knowledge on marine spatial planning across national jurisdictions (Dunn et al. 2014).

Figure 1. Areas within the study site, approximately two thirds of the world’s ocean.

Figure 1. Areas within the study site, approximately two thirds of the world’s ocean.

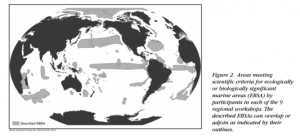
Therefore, the mosaic of these important marine ecosystems could be more clearly defined internationally.  Two technical teams held workshops to facilitate identifying/ranking areas that shared cross-jurisdictional boundaries and most relevant EBSA criteria. The Secretariat of the CBD hosted nine of these workshops from 2011 to 2014. This included experts from 92 countries and 79 regional/international organizations from all over the world. The workshop’s analysis finalized the 204 zones that met certain factors as EBSAs. Areas like these represent the most ecologically and biologically significant oceanic systems, based on biodiversity and the naturalness criterion (Bax et al. 2015). This information has been crucial to marine spatial planning and international negotiations on marine area management, beyond national jurisdictions.


 Figure 2. Areas within the study site that met the criteria for EBSA.


Figure 2. Areas within the study site that met the criteria for EBSA.

In fact, the results from this global effort have provided a new foundation of understanding for current marine spatial planning. The UN Convention of the Law of the Sea is a new agreement being formalized as a result. The 204 current EBSAs are being utilized as a guideline for this new legislation. It will provide a modernized system of sustainable practices and management of marine biological diversity worldwide. EBSA’s have become the key to providing an international standard and understanding to the most valuable oceanic ecosystems on our planet.

Figure 3. Examples of naturalness criteria.

Figure 3. Examples of naturalness criteria.

The critical role mangroves play with regards to ocean health

By Elana Rusnak, SRC Intern

What are mangrove forests?

There are many types of mangrove trees, but the three most common are the Red mangrove, White mangrove, and Black mangrove.

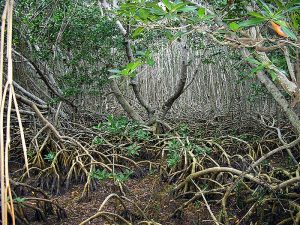
Figure 1: A mangrove forest in Ohio Key Florida Keys National Wildlife Refuge. FL photo courtesy of Phil M. C., February 19th, 2012. U.S. Fish and Wildlife Service Headquarters.

Figure 1: A mangrove forest in Ohio Key Florida Keys National Wildlife Refuge. FL photo courtesy of Phil M. C., February 19th, 2012. U.S. Fish and Wildlife Service Headquarters.

Red mangroves are distinguished by their large arrays of prop roots, which are long roots that may stem out from half way up the tree to reach the water and soil underneath.  They are extremely important with regards to gas exchange and allowing the trees to live in sediments with very low oxygen levels.  This is what makes mangroves so distinct—they not only live in salty, harsh conditions, but they thrive in them thanks to their unique adaptations.  The smallest roots that come off the main prop roots aid in stabilizing the fine silts and sands on top of the soil layers, as well as maintain both water clarity and quality.

White mangroves can take the form of either trees or shrubs, and their bark is white and relatively smooth.  They too have long root systems but tend not to be as extensive as Red mangroves.

Black mangroves look somewhat different from the previous two types in that they have horizontal cable roots that extend out from the trees at or below water level, with little branches called pneumatophores sticking up out of the water’s surface.  The leaves on this tree can have visible salt crystals on them due to the process by which the trees excrete the salt they take up with their root systems under the ocean’s surface.

These among other mangrove tree types cluster together along the Florida and Caribbean island coastlines in long ranges.  These forests used to be extremely abundant years ago, but due to deforestation they have greatly declined, here and around the world.

Why are they important?

While mangrove forests may just look like a bunch of trees living on the edge of the water, they are far more multi-faceted than one may think.  These large natural features protect coastlines from erosion, and actually aid in expanding them by collection of intertidal sediments.  Lots of detritus (dead organic matter) gets caught in the root systems, providing not only a source of food for the organisms living there, but an extra layer of rich soil that maintains the forests themselves.  These ecosystems are habitat to over 1300 species of animals.  They provide areas for breeding, nesting, foraging, and shelter for both resident and travelling organisms.

Mangroves are well documented to be widely used as juvenile fish nurseries due to the protective nature of their root systems against harsher open-ocean conditions.  Larger predators cannot easily maneuver through the smaller spaces, giving the young fish the time they need to feed and grow into a suitable adult ready to survive and succeed in an adult habitat.  The large prop root systems of mangroves give shelter to both juvenile species as well as permanent species that spend their entire life cycle among the roots.

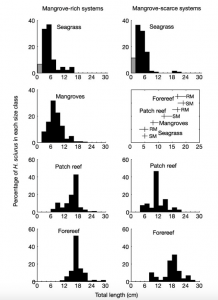
Figure 2: Statistical comparison of different environmental factors with regards to mangrove-rich and mangrove-scarce habitats (Mumby et al., 2004)

Figure 2: Statistical comparison of different environmental factors with regards to mangrove-rich and mangrove-scarce habitats (Mumby et al., 2004)

The above figure is from a paper by Mumby et al., in 2004.  It shows that while the abundance of seagrass beds are not necessarily affected by the presence of mangrove forests, patch reef length is significantly greater while affected by mangrove forest, and that reef fish H. sciurus is more normally (healthily) distributed in size in mangrove-rich systems.  The same paper also did a test on the distribution of Montastrea corals, which are coral heads that tend to have very high fish density.  They found that mangrove extent was a dominant factor in structuring these reef communities, and that they were integral in community structure and frequently exceeded the influence of coral reefs in that regard.  This shows the absolute importance of mangrove systems in keeping and maintaining the health of various other ecological systems surrounding them.

Why should I care?

As stated previously, in Florida and the Caribbean, mangroves used to have wide expanses of forests protecting the coastlines and creating these important habitats for many creatures, terrestrial and marine alike.  However, human influence and deforestation has caused a significant decline in area coverage of these important ecosystems.  Mangroves, in fact, are one of the most threatened tropical marine ecosystems worldwide, with greater than a 35% global loss rate.  With such a steep decline, it is possible to also see the declining health of the coastal systems that mangroves protect, as well as the erosion of the general coastlines that used to be so expansive.  With the lack of mangrove forests, all manner of species are also experiencing population declines.

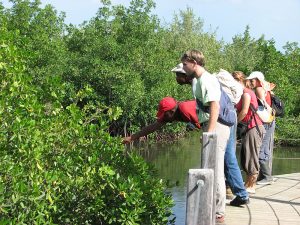
Figure 3: Young conservationists study mangroves at SCSCB training. Credit: SCSCB, November 13th, 2007. U.S. Fish and Wildlife Service Headquarters.

Figure 3: Young conservationists study mangroves at SCSCB training. Credit: SCSCB, November 13th, 2007. U.S. Fish and Wildlife Service Headquarters.

Humans have a tendency to claim whatever area they want and build houses, malls, marinas, etc. over the natural habitat many animals claim as their home.  If this trend continues, mangrove forests could be wiped out entirely, and the nursery and permanent habitats for a multitude of species could vanish.  This in turn could have many impacts on our lives, such as:  smaller fish populations of species we eat (nowhere for their juveniles to be safe), eroding coastlines (no protection from a wall-like mangrove forest), and an overall decrease in the natural and beautiful species native to particular areas that are integral for their survival.  Any amount of mangrove loss consequently means a loss of ecological, economic, and conservation functions.  Populations of fish that we eat will decline, which will be detrimental to the already above-carrying capacity fishing industry.

While it may seem that this is a far-away problem in the future, more advanced and supported conservation efforts need to begin and be maintained now in order for this precious ecosystem to survive.  It is so important to learn what these habitats do for our world so we can begin to teach others how to care for them and help save such an integral habitat for so many different organisms.

References:

Marine Spatial Ecology Laboratory, School of Biological and Chemical Sciences, University of Exeter, Prince of Wales Road, Exeter EX4 4PS, UK

Mumby, P. J., Edwards, A. J., Arias-Gonzalez, E., Lindeman, K. C., Blackwell, P. G., Gall, A., . . . Llewellyn, G. (2004). Mangroves enhance the biomass of coral reef fish communities in the Caribbean. Nature, 427, 533-536. Retrieved March 18, 2016.

U.S. Fish and Wildlife Service. (n.d.). Mangroves, Multi-species Recovery Plan for South Florida (pp. 3-519-3-545).

https://www.fws.gov/verobeach/MSRPPDFs/Mangroves.pdf

Valiela, I., Bowen, J. L., & York, J. K. (2001). Mangrove Forests: One of the World’s Threatened Major Tropical Environements. BioScience, 51(10), 801-815. Retrieved March 18, 2016.

Skate Overfishing: Studying and Protecting Data-Poor Fish Stocks

By Timothy Hogan, SRC Intern

In response to overfishing, scientifically-derived annual catch limits and other regulations were developed to protect many declining species. Despite this, some understudied organisms could not receive the same improvements, where minimum data and low resolution made their abundance relatively unclear. Catch limitations became relatively difficult to set, as the population trends of many species could not be analyzed with confidence. Recent studies have managed to develop approximate regulations despite the lack of data (Newman et al 2015). However, a lack of coordination and data review continues to leave gaps in our understanding of these organisms.

Skates, cartilaginous fish closely related to rays and sharks, are one of these data-poor species. Because of their low economic benefit, and the lack of understanding behind their aging and population dynamics, the aging and regulations behind these organisms become difficult to set with confidence (Miller et al 2009). As important predators that control the populations of many crabs, scallops, and other organisms on the seabed, they remain important to control and protect as some of the more data-rich species.

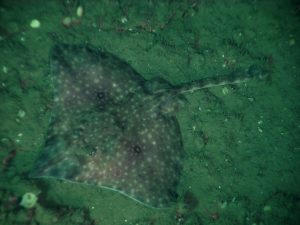
 Figure 1: A long-nose skate found off the coast of Washington. While similar to rays, skates are generally distinguished from their relatives due to their longer snout, two dorsal fins along their thicker tail, and thorn-like scales along their middle back

Figure 1: A long-nose skate found off the coast of Washington. While similar to rays, skates are generally distinguished from their relatives due to their longer snout, two dorsal fins along their thicker tail, and thorn-like scales along their middle back

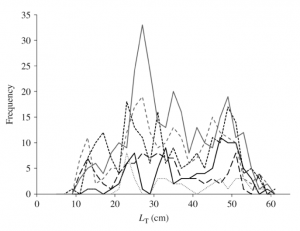
The northeast skate complex, composed of the seven species of skates found along the Northwest Atlantic shelf system, remains to be relatively well-studied and monitored compared to some other skate groups. While recent reports state that all but one species are not experiencing overfishing (Miller et al 2009), the low resolution of the data makes these results more inconclusive. Regulations are therefore generally set on the life history of these species, since species size and growth rate are common indicators of an organism’s resilience to fishing pressures (Frisk et al 2001). Studies by Kelly and Hanson (2013) show that the maturity age of two particular species, the winter skate and the little skate, is relatively late compared to most other commercial fish. These types of organisms, known as K-strategists, are put under careful monitoring by many regulation groups, as they tend to be the most susceptible to overfishing. Figure 1 showcases the overall population declines that have been observed from these effects (Kelly and Hanson 2013). The majority of individuals are not able to survive to maturity from fishing pressures, causing overall population declines over time. While this may also simply be due to the low catch and landing rates of skates, it is still important to consider the potential population decline and lengthened recovery time.

Figure 2: A frequency - size distribution of Little Skate specimens collected throughout various years. The solid gray line represents the year 2007, and shows a high peak below the age range of maturity, beginning at 32 cm. Samples from 2008 and 2009, the two dotted lines, are seen to be much lower. This could be due to a natural decrease from fishing pressures or a low catch number (Kelly and Hanson 2013)

Figure 2: A frequency – size distribution of Little Skate specimens collected throughout various years. The solid gray line represents the year 2007, and shows a high peak below the age range of maturity, beginning at 32 cm. Samples from 2008 and 2009, the two dotted lines, are seen to be much lower. This could be due to a natural decrease from fishing pressures or a low catch number (Kelly and Hanson 2013)

In the past, skates were targeted for their fins, which would primarily be used as lobster bait and occasionally food (Cavanagh and Damon-Randall 2009). However, because their slow reproduction rates increased their vulnerability, possession and landings of skates have been significantly reduced since 2003. Prior to this, the population conditions of the skates have been relatively unmonitored, making it difficult to tell the population state. Current regulations placed based on new data can hopefully encourage population rebuilding of these organisms, leading to an eventual recovery.

A more prominent and unmeasured cause of skate depletion both historically and currently has been bycatch. Because they are found throughout the deep waters of the coast, they can be unintentionally caught by fishing equipment that collect organisms from the seabed. Notably, haddock, an important commercial fish found in the Northeast Coast of the United States, were caught using trawling nets. While these could catch the target species relatively effectively, it was infamous for also taking many other organisms from the seabed, including crabs, flounders, and skates (Beutel et al 2008). In times of high fishing for these haddock, major effects can be observed on a variety of other organisms. The barndoor skate has been eradicated from specific geographic areas due to being caught in fishing gear alone (Cavanagh et al 2009).

Because of its effects and historical damage, it is crucial to take bycatch into account when developing regulations. For most organisms, it is difficult to quantify unintentional catches because of a lack of data. Most data-poor species do not have the same level of enforcement as some of the more commercially important species. When collecting numbers for fishing regulations, most data is collected on shore from samples present on the ship. When caught as bycatch, many skates and other organisms are simply discarded into the water before. Unfortunately, this leaves the most prominent source of population damage difficult to be measured.

Even without the necessary data, a variety of efforts have been made to reduce the potential bycatch on rays as well as other organisms. New technology is continuously developed to reduce bycatch, including an Eliminator TrawlTM which reduced skate by catch from 33.4% to 1.4% of the weight of the target haddock, allowing a significant amount of preservation (Beutal et al 2008). New regulations and methods are continuing to be established to these data-poor species, allowing more accurate fish stocks and subsequent to be developed for these species (Newman et al 2015). However, many of these elements remain in early development, and still require a significant amount of data before they can be used effectively.

In order to improve regulations on skate fisheries, it is imperative to put more effort into learning about skate dynamics. While there is limited information on many of these aspects, using more data-limited assessments to analyze these species may be used to collect data, though any conclusions should be monitored often. In the future, it is important for regional management offices to coordinate and pool their data, while also creating a standard set of regulations to maintain these organisms in multiple locations. The current best practices for protecting skates and other fish with minimal data are relatively unknown, but given communication and extensive studies, it remains possible for these organisms to be better preserved and understood in the future.

Bibliography

Newman, D., Berkson, J., and Suatoni, L (2015). Current methods for setting catch limits for data-limited fish stocks in the United States. Fisheries Research, 164, 86-93.

Phillips, S.RM, Scott, F., and Ellis, J.R (2015). Having confidence in productivity susceptibility analyses: A method for underpinning scientific advice on skate stocks? Fisheries Research, 171, 87-100.

Beutel, D., Skrobe, L., Kathleen, C., Rhule Sr., P, Rhule Jr., P, O’Grady, J., and Knight, J (2008). Bycatch reduction in the Northeast USA directed haddock bottom trawl fishery. Fisheries Research, 94(2), 190-198.

Frisk, M.G., Miller, T.J., and Fogarty, M.J (2001). Estimation and analysis of biological parameters in elasmobranch fishes: a comparative life history study. Can. J. Fish. Aquat. Sci., 58, 969-981.

Kelly, J.T. and Hanson, J.M. Maturity, size at age and predatory-prey relationship of winter skate Leucoraja ocellata in the southern Gulf of St. Lawrence: potentially an undescribed endemic facing extirpation. Journal of Fish Biology, 82, 959.

Millers, T., Muller, R., O’Boyle, B., and Rosenberg, A. (2009). Report by the peer review panel for the Northeast data poor stocks working group. Woods Hole (MA): Northeast Fisheries Science Center. Report for the Data Poor Assessment Working Group.

Cavanagh, M.F., and Damon-Randall, K (2009). Status of the barn door skate (Dipturus laevis). National Marine Fisheries Service Report, Northeast Regional Office.

Bowley, S. (2008, April 12). A long-nose skate. Washington, Olympic Coast NMS. Retrieved March 17, from Wikimedia Commons: https://commons.wikimedia.org/wiki/File:Olympic_Coast_National_Marine_Sanctuary2008_Rajidae.jpg

Impacts of parasites on marine survival of Atlantic salmon: a meta-analysis

By Elana Rusnak, SRC Intern

In both wild and captive populations of Atlantic salmon, their most prevalent parasite in Norway, Lepeophtherius salmonis, or “salmon lice”, can have lethal effects on these fish.  A common way to measure the overall effect these parasites have on smolt populations (young salmon making their first voyage from their home river to the ocean, where they mate) is to administer an antiparasitic treatment to one group, and leave an untreated control group at the beginning of their migration, and then recapture as many as possible on their return.  Once recaptured, the salmon are analyzed for the number of salmon lice per fish, and then these data are sent into the Norwegian government for monitoring.

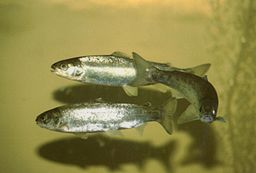
Figure 1: Atlantic salmon smolts. Their silvery color shows that they are ready to leave their freshwater home and migrate to the ocean, where they breed.

Figure 1: Atlantic salmon smolts. Their silvery color shows that they are ready to leave their freshwater home and migrate to the ocean, where they breed.

A study done by Vollset et. al. in 2015 reviewed all of the published and unpublished data and research that has been done on multiple Atlantic salmon populations in the rivers, oceans, and fjord systems in Norway.  The purpose of amassing all of this data was to estimate the treatment effectiveness and survival of Atlantic salmon across studies, and to evaluate whether salmon lice pressure from salmon farms along the smolt migration routes affected variation in treatment effect.  In total, the researchers used a dataset of 118 release groups dating from 1996-2011, comprising of 657, 624 fish released, and 3,989 recaptured.

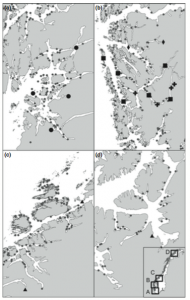
Figure 2: Location of smolt releases along the coastline of Norway. Fish farms are indicated by gray dots. The various release locations are indicated by circles, squares, crosses, diamonds, and triangles, and they are grouped together based on pooling in the meta-analysis.

Figure 2: Location of smolt releases along the coastline of Norway. Fish farms are indicated by gray dots. The various release locations are indicated by circles, squares, crosses, diamonds, and triangles, and they are grouped together based on pooling in the meta-analysis.

Complicated statistical meta-analyses were completed to analyze the large quantity of data collected by the researchers.  Frequently, meta-analysis is considered to provide the highest level of evidence as to the effect of a treatment.  The researchers attempted to take everything that could affect the results of the literature review into account, including heterogeneity (variance in estimates of treatment effect across studies), baseline survival (proportion of fish recaptured in the non-treated group), and publication, information, and selection bias.  One of the most prominent tests they did was to calculate the risk ratio (RR) of the treatment in each release group.  The risk ratio is defined as the probability of being recaptured in the treated group, divided by the probability of being recaptured in the control group.  A higher RR means more treated fish were recaptured than control fish, which may show a correlation between the survival rate and the antiparasitic agent used on the fish.

After analysis, multiple variables were statistically significant at a p-value less than 0.2, including release location, release period, and baseline survival.  Traditionally in science, p-values are usually considered significant at 0.05 or lower—so what does this mean?  If a variable or result is statistically significant, it shows that there is a difference in what you are testing, or that a relationship exists.  A lower p-value generally corresponds to a more significant result.  Since this study claims significance at 0.2, it means that while the above variables had an effect on the result, it was not to an enormous degree.

With that being said, the researchers found that baseline survival was a major predictor of the results, suggesting that RR is high when survival in the control group is low, and RR is low when survival in the control group is high.  Baseline survival was shown to also decrease when release location was farther away from the ocean—the fish have to migrate more in order to reach their breeding grounds, so they have higher exposure to parasites than fish migrating through shorter expanses of water.

What did the researchers conclude?

Overall, the results led the researchers to conclude that the antiparasitic treatment increases survival in the release groups.  However, when taking all the varied data into account, the treatment was very beneficial in some groups, while in others, there seemed to be no effect on the return rate of the salmon.  This variation could be explained by where the fish were released and the baseline survival.  The meta-analysis supports the hypothesis that long-acting antiparasitic treatment can protect salmon smolts from salmon lice during outward migration and that salmon lice is a contributor to the mortality of salmon.  Similarly, none of the salmon lice exposure estimates from the production of lice from fish farms had any significant effects on the RR estimates.

The results of this study show a significant, but small beneficial effect of the antiparasitic treatment on Atlantic salmon in Norway.  However, the results do convey that salmon lice do contribute to the mortality of Atlantic salmon, and if they can be regulated, there is a possibility for higher rates of survival in the salmon.  While this study is extremely narrow and specific, studies like this could lead to better management of both wild and cultivated populations of Atlantic salmon in other parts of the world.  An understanding of the natural adversity that these species face could contribute to higher quality maintenance of fisheries and wild populations under conditions favorable to a high survival rate.

Paper referenced:

Vollset, K. W., Krontveit, R. I., Jansen, P. A., Finstad, B., Barlaup, B., Skilbrei, O. T., . . . Dohoo, I. (2015). Impacts of parasites on marine survival of Atlantic salmon: A meta-analysis. Fish and Fisheries, 1-17. Retrieved February 28, 2016.

Great Barrier Reef No-Take Areas Include a Range of Disturbance Regimes

By Shubham Mathur, SRC Intern

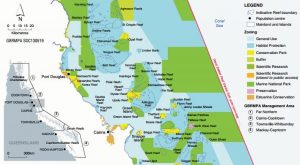
Figure 1: Zoning map for the Cairns area within the Great Barrier Reef Marine Park describing different zoning designations. The Inset map provides a reference to the location of the region in a broader scale.

Figure 1: Zoning map for the Cairns area within the Great Barrier Reef Marine Park describing different zoning designations. The Inset map provides a reference to the location of the region in a broader scale.

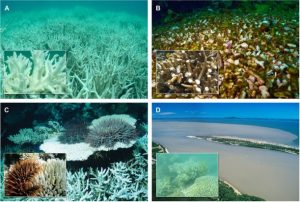
The zoning of marine protected areas and reserves that prohibit or reduce human activity is a common example of spatial management used to protect natural assets for current and future benefit. Both the distribution and size of the protected areas are crucial factors in their effectiveness. Marine spatial planning (MSP) is crucial for developing effective protections, taking a number of factors into account including current and predicted future patterns of use, the habitat condition, how well represented the habitat already is in marine protected areas, and key ecological processes such as larval connectivity. The Great Barrier Reef Marine Park off the coast of Eastern Australia is considered to be a global icon of marine ecosystem management. The Marine Park was rezoned in 2004 in order to increase the reach and effectiveness of no take areas over the park. An expert focus group suggested that a minimum of 20% of the Marine Park should be protected by no take areas. This incorporated events such as cyclones, pollution, climate change, and other major disturbances into account. At the time, limited data did not allow re zoning to take into account variation in exposure of the reefs to disturbances. The Great Barrier Reef Marine Park should have management objectives should incorporate aspects of dynamic phenomena. For the purposes of this study, four coral mortality causing disturbances were studied in the context of special patterns of exposure. These disturbances are mass bleaching events, cyclones, crown of thorns starfish, and low salinity.

Figure 2: (A) Thermal stress related coral bleaching (B) Damage caused by cyclone waves (C) Damage caused by crown of thorns starfish outbreaks (D) Damage resulting from excessive freshwater inundation

Figure 2: (A) Thermal stress related coral bleaching (B) Damage caused by cyclone waves (C) Damage caused by crown of thorns starfish outbreaks (D) Damage resulting from excessive freshwater inundation

The researchers gathered data on the four harmful disturbances found on the reef, collecting information regarding bleaching level thermal stress from 1982 to 2012, damaging waves from cyclones from 1985 to 2014, crown of thorns starfish outbreaks from 1982 to 2014, and freshwater inundation from 2001to 2011. The values for different levels of exposure for each disturbance were standardized, resulting in a scale from 0 to 1, where lower values indicate lower exposure, and higher values indicate higher exposure. Relative exposure was assessed by finding the mean scores of all four disturbances across the surveyed areas.

The relative exposure of the reef to bleaching resultant thermal stresses was relatively high for a little over 20 percent of the reef area, while a little over 30 percent of the reef area experienced a low exposure to thermal stresses. Similarly, approximately 20% of the reef experienced a high exposure to damaging waves from cyclones, and a little under 30% experienced low exposure. High exposure to the crown of thorns starfish was much more limited, at about 14% of the reef area, and 96% of the reef experienced no exposure to freshwater inundation. Only about 0.1% of the reef remained disturbance free for the duration of the surveys.

The analysis showed that even in no take areas, much of the reef suffered from one or more examples of harmful disturbances. This conclusion indicates that one of the most helpful things to do, would be to employ extra protections on the regions that did not experience any of the disturbances. Vulnerability for the different regions of the reef can be calculated by factoring exposure and sensitivity, along with the adaptive capacity of the area. A strong understanding of resilience and exposure allows for adaptive, resilience based management to maximize their benefits to the reefs, ensuring the future health and survival of the reef environments.


Maynard, J. A., Beeden, R., Puotinen, M., Johnson, J. E., Marshall, P., Hooidonk, R., … & Ban, N. (2015). Great Barrier Reef no‐take areas include a range of disturbance regimes. Conservation Letters.

Ocean Acidification and Its Effect on Bacterial Communities

By Casey Dresbach, SRC Intern

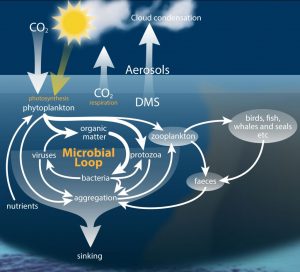
The pH of the ocean is changing incrementally, as a result of increases in atmospheric carbon dioxide. As shown in Figure 1, a proceeding decline in seawater pH has been induced by ocean acidification and will continue over the next hundred years. The ocean is expected to decline an average of 0.3 pH units by the end of the century. Changing the geochemistry of the ocean is consequently changing the biogeochemical processes of the sea, including marine microbial populations. The microbial community is extremely important to the marine carbon cycle in their role to decompose and recycle nutrients, as shown in Figure 2.

Figure 1. Predicted Ocean Surface pH Through the Year 2100.

Figure 1. Predicted Ocean Surface pH Through the Year 2100.

The ocean maintains a viable level of carbon dioxide from such decomposition and subsequent respiration of organic molecules by heterotrophic bacteria. Since the industrial boom, the human obsession to industrialize is continually offsetting the balance of the ocean’s carbon dioxide levels and setting up a future of mutational distress. The burning of fossil fuels (primarily coal) and its emissions are manipulating the ocean for the worse.

Figure 2. Microbial communities graze, break down, recycle and respire nutrients in the ocean helping to maintain an interconnected web of carbon transfer.

Figure 2. Microbial communities graze, break down, recycle and respire nutrients in the ocean helping to maintain an interconnected web of carbon transfer.

Researchers Ian Joint, Scott C. Doney, and David M Karl wrote an article for the ISME Journal regarding their perspectives on the question, “Will ocean acidification affect marine microbes?”

The reasoning behind their perspective has much to do with the lack of proper research done addressing the issue of microbial function in a lowered pH oceanic environment. Much is known about calcifying organisms, such as corals and coccolithiphores, in regards to ocean acidification. With an increase in acidity, maintaining calcite and aragonite shells and skeletons becomes nearly impossible.

Most studies that are published include discussions of the ocean pH in the context of geological time scales in spatial uniformity of pH for the present-day ocean. However, pH of the oceans is not constant and there are considerable seasonal, depth, and regional variations that come into play. With that in mind, pH is naturally variable and marine organisms-particularly microbes-must already be capable of adapting to rapid and sometimes large changes in pH. Kai T. Lohbeck, Ulf Riebesell and Thortsten B. H. Reusch published an article for Nature Geoscience regarding the topic of adaptive evolution of a key phytoplankton species to ocean acidification. According to the article, they suggested that contemporary evolution could help to maintain the functionality of microbial processes at the base of marine food webs in the face of global change; that these organisms are currently facing evolutionary adaptations.

The pH levels in the ocean are not consistent, especially when considering other variables such as light, temperature, and depth. The multifactorial relationship among these variables is direct. Researchers Ian Joint, Scott C. Doney, and David M Karl presented a null hypothesis to be tested: marine microbes posses the flexibility to accommodate pH change and there will be no catastrophic changes in marine biochemical processes that are driven by phytoplankton, bacteria, and archae.

In an alternate scientific publication by J. Piontek, M. Lunau, N. Händel, C. Borchard, M. Wurst, and A. Engel, a study was conducted in regards to acidification increasing microbial polysaccharide degradation in the ocean. The ocean’s capacity for carbon dioxide storage is strongly affected by biological processes whose feedback potential is unfortunately difficult to evaluate. This article coincides with the previous considering that very little is known about potential effects ocean acidification poses not only on the microbial community themselves, but on bacterial degradation activity as a whole. Polysaccharides are a major component of organic matter, an energy source for the majority of bacterial communities. Their breakdown by bacterial enzymes seemed to have significantly accelerated during J. Piontek, M. Lunau, N. Händel, C. Borchard, M. Wurst, and A. Engel’s experimental simulation of ocean acidification. An experiment was set up to test the rate of enzymatic polysaccharide hydrolysis (how quickly bacteria could break down the macromolecule) in natural bacterioplankton communities. In this experiment, two environments were simulated: one being present day pH levels – what the ocean’s pH level is today and the latter being future day pH levels – what the ocean’s pH levels are predicted to be in the next hundred years. After each sample was incubated, concentrations of dissolved and particulate combined glucose, galactose, arabinose, and other sugars and acids were also detected. These concentrations represented the complexity of the relationships between the variables that come into play with acidification. This allowed the scientists to relate the differences in glucosidase activity (enzymes which break down glucose) and macromolecule concentration between present-day and future-ocean treatment to the increase in hydrogen ion concentration. Figure 3 illustrates the results of the above experiment with regards to an additional variable, permanent dark incubation and dark cycling incubation. The experiment revealed that the observed increase in glucosidase activity was directly proportional to the increasing acidity of the ocean water in a simulated acidification model. They also came to realize that changes in the enzymes’ activities reflected a community response of bacterioplankton to the simulated acidification as well. A collective conclusion of the experiment goes as follows: experimental results suggest that increased glucosidase activity at lowered seawater pH does not depend on the abundance of some specific bacterial strains, but reflects a community response to lowered seawater pH. This response could indicate that bacterial communities are currently undergoing adaptations to adjust to the decreasing pH. Higher enzymatic rates at lowered seawater pH are a chemical acidification effect on natural enzyme assemblages that is beneficial for the bacterial metabolism. Some might go on to further assume that come a more acidic oceanic environment, bacterioplankton communities will readily adapt and will not counter enhanced polysaccharide degradation. With a quicker degradation of polysaccharides, the bacterioplanktonic communities might flourish, quicker breakdown of sugars to be used as an energy source while simultaneously recycling nutrients back into the food web during degradation.

Figure 3. Percent loss of different macromolecules in present day oceanic pH levels and future pH levels with regards to another variable: permanent dark incubation and dark cycling incubation.

Figure 3. Percent loss of different macromolecules in present day oceanic pH levels and future pH levels with regards to another variable: permanent dark incubation and dark cycling incubation.

Results from different studies and perspectives show that a lot of variables must be considered when focusing on the question, “Will ocean acidification affect marine microbes?” Current analysis and comparison of freshwater pH and seawater pH is only so significant because the pH in freshwater acts on a short-term scale and the ocean acts on a far longer term. The ocean is too complex; there are too many variables to continue with the current broad-scale state of research.. Studies should go into the “micro-economics” of the ocean and its harmful relationship with acidification. There is more potential for a better understanding of a correlation between microbial communities and ocean acidification if things are broken apart and analyzed. Studying and analyzing the consequences of changes in individual variables, such as a potential threat to a major energy source of microbial communities (polysaccharides), can infer if there is in fact a present evolutionary adaptation of microbes to the increasingly acidic ocean.  It’s also important to consider the possibility that microbial communities will adapt to the changes in pH but only to a certain degree before the rate of adaptation plateaus and these communities can no longer keep up with the consistent decrease in pH in the next one hundred years.

Resources

Ian Joint, S. C. (2010, June 10). Will ocean acidification affect marine microbes?. ISME Journal.

Piontek, M. L. (2010, May 19). Acidification increases microbial polysaccharide degradation in the ocean. Biogeosciences.

Kai T. Lohbeck, U. R. (2012, April 8). Adaptive evolution of a key phytoplankton species to ocean acidification. Nature Geoscience.

Oakes, M. (2013, June). Changes: Forecase for Marine Mircrobial Communities. Retrieved February 21, 2016, from Antarctica: http://www.antarctica.gov.au/magazine/2011-2015/issue-24-june-2013/science/changes-forecast-for-marine-microbial-communities

Stocker, T. D. K. Climate Change 2013: The Physical Science Basis. Cambridge and NY,UK and USA: IPCC.


Effects of fishing rope strength on the severity of large whale entanglements

By Leila AtallahBenson, SRC Intern


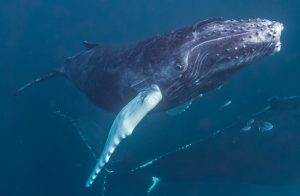
Figure 1. A free swimming humpback whale, that managed to avoid fishing gear entanglements.

Figure 1. A free swimming humpback whale, that managed to avoid fishing gear entanglements.

On top of whales being majestic giants that are exciting to watch, they are also an important animal for marine ecosystems. They enhance primary productivity in nutrient lacking areas and ocean surfaces, and their carcasses provide habitat and energy sources for deep-sea species1. In both these instances, whales fix carbon, turning inorganic carbon to organic compounds. This not only makes more room for carbon to be absorbed, helping with global warming, but contributes to the available amount of organic matter that marine organisms utilize. Whales are also important to the economy, drawing in around $2 billion per year through whale-watching businesses2.

Unfortunately, these species are prone to human fishing gear entanglements, since they are so large and often spend time in prime fishing areas. Once a whale is entangled the individual can drown quickly, or may be able to breath but later dies from starvation, injuries endured by the fishing gear, increased energetic demands, or stress3. These entanglements often come from pot/trap and gillnet fisheries4. Protecting these species not only helps whales, but helps protect our oceans and economy.

Between 1994 and 2010, Knowlton et al. explored the breaking strength of 132 fishing ropes that were found on 70 whales. This included 30 right, 30 humpback, 2 fin, and 8 minke whales, all along the east coast of the United States. In the U.S., fin and humpback whales are protected, and both in the US and Canada, right whales are protected by law. All of the whales that rope was collected from were categorized by species. Right and humpback whales were also separated by age group. The severity, configuration, and any injuries of the entanglement were recorded with pictures.

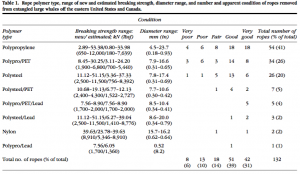
Most of the gear sampled was retrieved by the Atlantic Large Whale Disentanglement Network. The entangled rope strength was determined. The majority of entangled rope was found to be in good or very good condition. The rope material, its diameter, breaking strength, condition, and how many of that rope found were considered (table 1).

AtallahBenson_Table 1

The authors asked a few questions from this information. One question was if injury severity is related to rope strength? For right whales this proved to be true. With increased rope strength, right whales had more severe injuries. However, this was not true for humpback whales, whose injuries did not get worse with rope strength, but their injuries seemed to be more randomized.

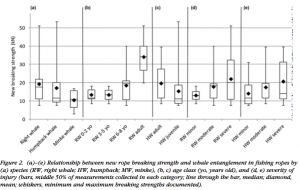
Another important question asked was if rope strength correlated with whale species or age (see figure 2)? Some of these correlations were clear to see in the evidence. Both right and humpback whales were found with ropes of higher breaking strength than minke whales. Adult right whales were found in significantly stronger rope than juvenile right whales, and both adult and juvenile humpback whales. The average breaking strength was 19.30 kilonewton (nK) for right whales, 17.13 kN for humpback whales, and 10.47 kN for minke whales. The 2 fin whale ropes were 11.12 and 31.14 kN.

AtallahBenson_Figure 2

This information helps us take a better look at the fishing gear we use now, and allows us to make changes to better protect these magnificent creatures. There were only limited numbers of whales that were entangled in rope strengths below 7.65 kN. The use of special ropes, called reduced breaking strength (RBS) ropes, of 7.65 kN or less could reduce whale entanglements at least by 72%. Fisherman in the study area haul about 2.24-3.11 kN for lobster, 2.45-3.11 for stationary gillnets, and at most 6.38 nK for dragging gillnets. These RBS ropes of 7.65 would work for these normal fishing endeavors, and save the whales at the same time. So the next time you’re going out fishing, be sure to grab some RBS rope and help save the whales!

References

Knowlton AR, Robbins J, Landry S, McKenna HA, Kraus SD, Werner TB. 2015. Effects of fishing rope strength on the severity of large whale entanglements. Conservation Biology: 1-11.

1 Roman J, Estes JA, Morissette L, Smith C, Costa D, McCarthy J, Nation JB, Nicol S, Pershing A, Smetacek V. 2014. Whales as marine ecosys- tem engineers. Frontiers in Ecology and the Environment 12:377– 385.

2 O’Connor S, Campbell R, Cortez H, Knowles T. 2009. Whale Watching Worldwide: tourism numbers, expenditures and expanding economic benefits, a special report from the International Fund for Animal Welfare, Yarmouth MA, USA.

3 Moore MJ, van der Hoop J, Barco SG, Costidis AM, Gulland FM, Jepson PD, Moore KT, Raverty S, McLellan WA, editors. 2013. Cri- teria and case definitions for serious injury and death of pinnipeds and cetaceans caused by anthropogenic trauma. Diseases of Aquatic Organisms 103:229–264.

3 Cassoff RM, Moore KM, McLellan WA, Barco SG, Rotstein DS, Moore MJ. 2011. Lethal entanglement in baleen whales. Diseases of Aquatic Organisms 96:175–185.

3 Pettis HM, Rolland RM, Hamilton PK, Knowlton AR, Kraus SD. 2004. Visual health assessment of North Atlantic right whales Eubal- aena glacialis using photographs. Canadian Journal of Zoology 82: 8–19.

4 Johnson A, Salvador G, Kenney J, Robbins J, Kraus S, Landry S, Clapham P. 2005. Fishing gear involved in entanglements of right and hump- back whales. Marine Mammal Science 21:635–645.

The Effect of Materialism on Ecotourism Attitudes, Interest, and Intention

By Dana Tricarico, SRC Intern

The term “ecotourism” has been widely used since the late 1980s and has become a major niche in not only the tourism sector itself, but also in tourism studies (Weaver and Lawton, 2007). Traditional approaches to conserving biodiversity in ecologically important areas have proved to be ineffective due to conflicts between park authorities implementing conservation laws and the local people to those protected areas. Ecotourism has provided a solution to this problem by combining protection of areas with cooperation from the local people so that these people feel empowered and a part of the management decisions (Lai and Nepal, 2006). Despite the positives of this form of tourism, especially in places like small island destinations, which are known for their unique cultures and remoteness, there are still challenges with implementing this replacement to mass tourism. First and foremost, local authorities need to not only see the potential for tourism in these particular locations, but they must provide strong leadership to maintain the community’s engagement and continue to empower the local people. Many governments feel pressured to join the pattern of traditional mass tourism by building large resorts which causes them to lose sight of how rewarding it can be to have sustainable forms of tourism instead (D’Hauteserre, 2015). Researchers Allan Cheng Chieh Lu et. al (2014) decided to look at ecotourism from a different angle.  Rather than the implementation, they investigated the traveler aspect of ecotourism.

A native of French Polynesia demonstrates sustainable tourism by leaving a low environmental footprint when making cloths and souvenirs with strips of tapa. (Hauteserre)

A native of French Polynesia demonstrates sustainable tourism by leaving a low environmental footprint when making cloths and souvenirs with strips of tapa. (Hauteserre)

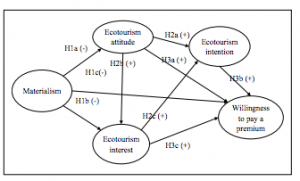
This particular study looked at how materialism influences ecotourism attitude, ecotourism interest, ecotourism intention as well as the willingness to pay a premium for ecotourism. In order to capitalize on the values that ecotourism promotes and to try and fix the issues associated with it, this type of research is important to see the values that may influence travelers and their opinions about taking part in ecotourism. Materialism, i.e., the emphasis people place on the satisfaction of life from their possession of material goods, is very prominent in the western society and has been increasing for decades. Therefore, this thought process is important in tourism studies because it can conflict with environmental conservation, a major component of ecotourism. This is because environmental conservation often goes hand in hand with decreasing overconsumption and recycling old goods.

The beginning stages of this research entailed a literature review, which was done to create hypotheses based on prior research. After doing so, a conceptual framework was created to show their findings. The study itself was done by collecting data from 2,352 Italian travelers using an online self-administrated questionnaire. The survey had seven sections, six of which measured different concepts with the seventh measuring the demographics of the respondents. To measure ecotourism interest, ecotourism attitude, and willingness to pay a premium, the respondents were given statements related to each of those topics being measured and then asked to rank them. This scale was from 1-7 with 1 representing that statement was not important to them, and 7 representing that it was very important to them. To interpret the results, statistics were used using the Statistical Package for Social Sciences (SPSS).

Photo 2: Conceptual framework for the study by Lu et. al which organizes determinants of ecotourism behavior into five categories. This was created by putting together literature reviews and creating nine hypotheses based on this framework (Lu)

Conceptual framework for the study by Lu et. al which organizes determinants of ecotourism behavior into five categories. This was created by putting together literature reviews and creating nine hypotheses based on this framework (Lu)

The results showed that high value for materialism can negatively influence ecotourism attitude, ecotourism interest, and willingness to pay a premium for eco-tourism products. This is in line with previous research done by Porritt (1984) which explained that a great deal of the issues involved with the global environmental decline is because of materialism. The findings also concluded that, due to the cognitive dissonance associated with having a high desire for material possessions but also wanting to help with environmental issues through eco-tourism, may result in eco-tourism appearing as an unattractive type of leisure.

The conclusions from this study provide practical implications for ecotourism operators as it highlights the necessity to use forms of communication to increase the amount of positive attitudes toward ecotourism. A movement must first garner substantial support before it can truly make an impact, however. For example, ecotourism operations and service providers would need to emphasize the importance of preserving the environment and culture within specific regions through events, media outlets, and advertisement, while at the same time demonstrating the benefits to the local community and the individuals visiting the community (Lu, 2015).  There are many challenges that affect the success of not only implementing ecotourism, but also to catering to the tourists who are highly materialistic. With extensive long-term commitment to educating highly materialistic people about the importance of preserving the environment, however, ecotourism can prove to be extremely beneficial for visitors, locals, and the environment alike.


Works Cited

Porritt, J. (1984). Seeing Green: The Politics of Ecology Explained. New York: Blackwell.

Weaver, D. B., and L. J. Lawton. (2007). “Twenty Years on: The State of Contemporary Ecotourism Research.” Tourism Management, 28 (5): 1168-79.

Dhauteserre, A.-M. “Ecotourism an Option in Small Island Destinations?” Tourism and Hospitality Research 16.1 (2015): 72-87. Web.

Lu, A. C. C., D. Gursoy, and G. Del Chiappa. “The Influence of Materialism on Ecotourism Attitudes and Behaviors.” Journal of Travel Research 55.2 (2014): 176-89. Web.

Lai, Po-Hsin, and Sanjay K. Nepal. “Local Perspectives of Ecotourism Development in Tawushan Nature Reserve, Taiwan.” Tourism Management 27.6 (2006): 1117-129. Web.