A Study of Microplastics in San Francisco Bay
By Lauren Kitayama, SRC intern
Introduction
Microplastics (defined as being < 5mm in size) are small enough to be ingested by filter feeders and planktonic organisms. Studies have shown that the average seafood consumer could be ingesting 11,000 pieces of microplastic annually (Cauwenberghe & Janssen, 2014). The human health impacts are not well understood, but preliminary research suggests that the particles themselves may not be able to pass through the intestinal wall. However, additives and toxins including chemicals that are known carcinogens and hormone disruptors are still a cause for concern (Galloway, 2015) Microplastics come as pre-production beads (often called nurdles), exfoliating beads in personal car products, microfibers that come from washing synthetic clothes, and the breakdown of larger plastics already in the ocean.

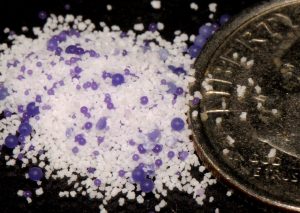
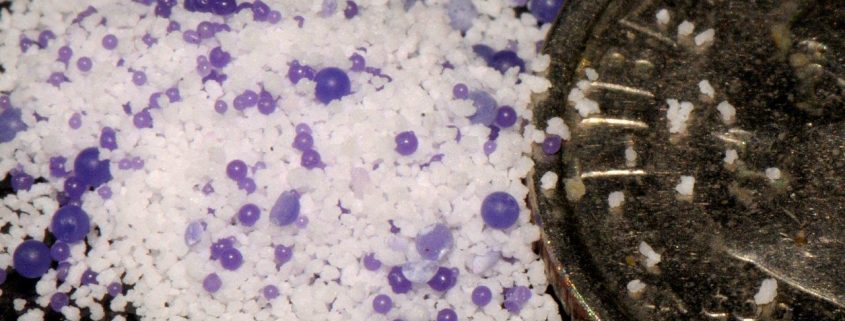
Plastic from facial scrub next to a dime. Photo credit: Dave Graff. Source: plasticaware.org
Average measurements of 700,000 microplastic particles/ km2 (range: 15,000-2,000,000 particles/km2) makes the waters of San Francisco Bay the most microplastic polluted body of water sampled in North America.
Microplastics in San Francisco Bay
In 2016, researchers sampled eight wastewater treatment facilities that discharged into the San Francisco Bay. These facilities represent about 60% of wastewater discharged into the Bay. They voluntarily allowed researchers to sample their final effluent (the water that would be directly released). The rate of microplastic discharge from the wastewater treatments plants was 0.086 particles per liter, which equates to about 90 million particles a day. There was no difference among discharge rates between facilities that had secondary or tertiary treatment suggesting that waste water treatment plants are ineffectual at capturing and removing microplastics from waste water. Fibers were the most common type of microplastic found.
Samples were collected once from each wastewater facility during peak flow by passing the wastewater through 0.355 mm and 0.125mm sieves for 2 hours. They were then cleaned, and organic material was dissolved. Plastic particles were visually identified, and classified as one of five categories: fragment, pellet, fiber, film or foam.
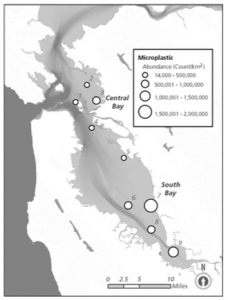
Microplastics were also sampled at 9 sites inside the bay using a Manta Trawl and standard protocols. These surveys occurred at rising tides. Samples were cleaned, all organic material removed and visually classified just like the wastewater samples. All surface samples contained plastic ranging from 15,000 to 2,000,000 particles/ km2. On average, density was higher in SF Bay, than the Great Lakes, Chesapeake Bay and Salish Sea.

Estimated abundance of microplastic particles in surface water at nine sites in San Francisco Bay. Circles are located at trawl midpoints. (Sutten et al, 2016).
High concentrations of microplastic pollution in the San Francisco Bay could be due to a high urban population surrounding a small, closed body of water. However this does not necessarily explain why densities would be higher in San Francisco Bay than in other urban surrounded bodies of water. Possible explanations include water conservation measures taken by the state during a severe drought that concentrates plastic. Other pollution pathways such as runoff and fragmentation may also play a large role. This study was an initial snapshot of microplastic pollution in SF Bay. Its findings indicate the need for more in-depth studies to look at the possible effect of tidal flux, 24-hour water use differences and impacts of storm water runoff. It also makes clear the need to better understand the implications of exposure to wildlife and humans. (Sutton et al, 2016).
The Bigger Picture on Little Plastics
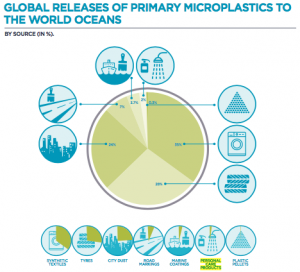
Microplastics are becoming increasingly recognized as a threat to ocean and human health. Global release of primary microplastics is estimated to be 1.5 Mtons/year (Boucher & Friot, 2017). Microbeads in personal care products are often considered to be a large source of these microplastics. In fact in 2015 US passed the Microbead-Free Waters Act, banning the manufacturing and sales of products with microbeads with the intent of decreasing microplastic pollution in the countries waterways (2015). Canada, Ireland, the UK and the Netherlands have similar national legislation. But recent reports show that these exfoliating microbeads represent a small portion of microplastics pollution (2%). Whereas microfibers, released during the laundering of synthetic materials represents 35% of microplastics (Boucher & Friot, 2017).

Breakdown of primary microplastic loss into the ocean. (Boucher & Friot, 2017).
Companies like Patagonia have begun recognizing this threat to the planet, and are investing in solutions like a laundry bag that captures microfibers before they get blown out of the drier vent (O’Connor, 2017).
Work Cited
Sutton et al (2016). Microplastic contamination in the San Francisco Bay, California, USA. Marine Pollution Bulletin 109: 230-235. http://dx.doi.org/10.1016/j.marpolbul.2016.05.077
Microbead-Free Waters Act. (2015). 21 U.S.C. 331. https://www.gpo.gov/fdsys/pkg/BILLS-114hr1321enr/pdf/BILLS-114hr1321enr.pdf
O’Connor, M. (2017). Microfibers are polluting our food chain. This laundry bag can stop that. The Guardian. https://www.theguardian.com/sustainable-business/2017/feb/12/seafood-microfiber-pollution-patagonia-guppy-friend
Cauwenberghe, L. and Janssen, C. (2014). Microplastics in bivalves cultured for human consumption. Environmental Pollution 193: 65-70. http://dx.doi.org/10.1016/j.envpol.2014.06.010
Boucher, J. and Friot D. (2017). Primary Microplastics in the Oceans: A Global Evaluation of Sources. Gland, Switzerland: IUCN. 43pp. https://portals.iucn.org/library/sites/library/files/documents/2017-002.pdf
Galloway, T. (2015). Micro- and Nano-plastics and Human Health. Marine Anthropogenic Litter pp 343-366. http://link.springer.com/chapter/10.1007/978-3-319-16510-3_13


Leave a Reply
Want to join the discussion?Feel free to contribute!